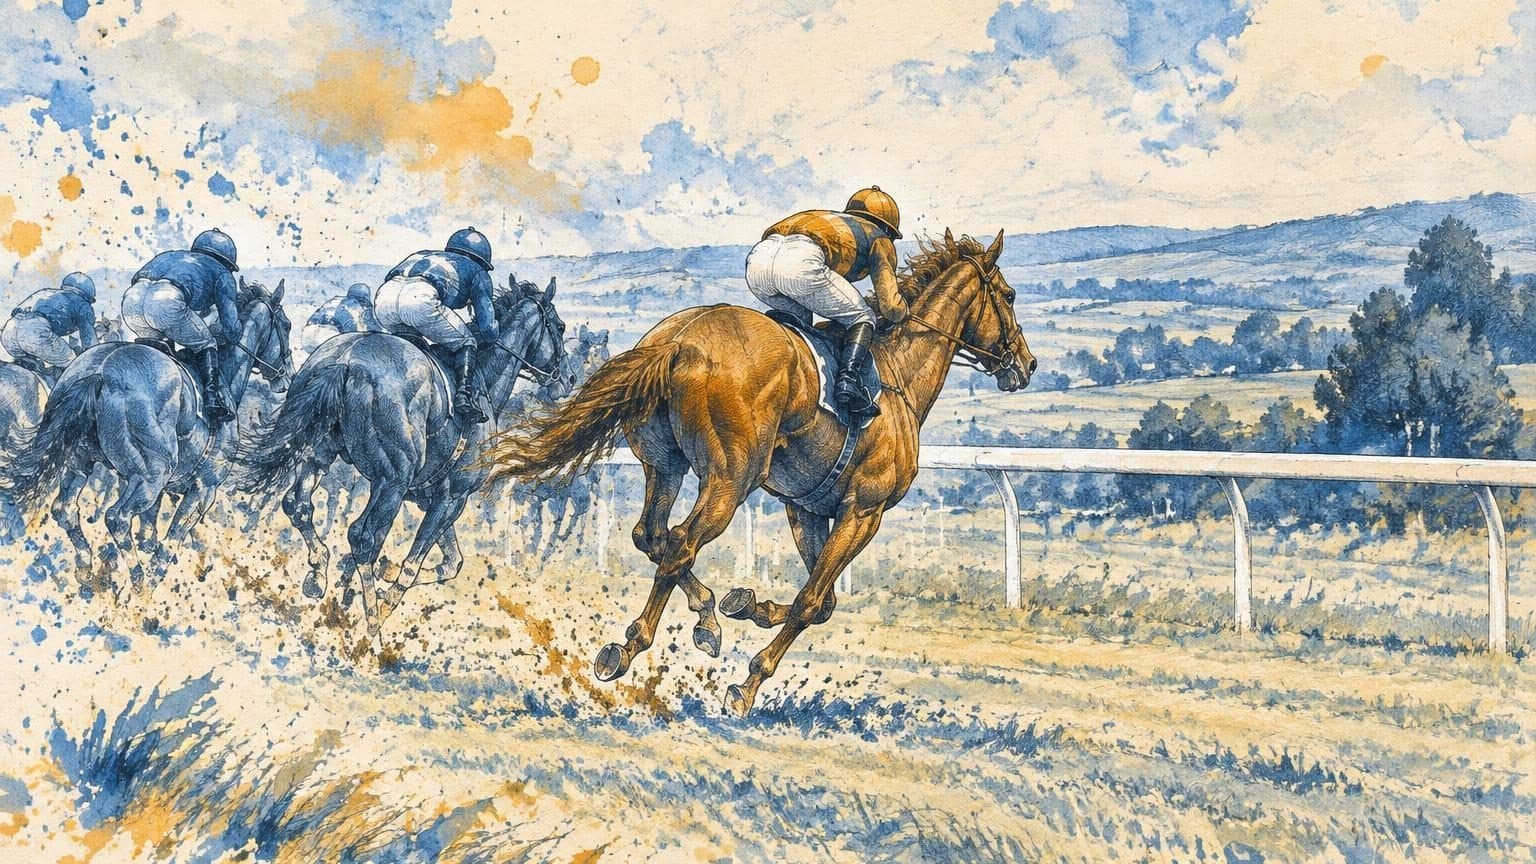
It is a wet Saturday in November. Eight horses go to post for a Class 4 chase handicap on properly soft ground at Wetherby. Half of them have ticked off some flavour of “course form” or “good last time” or “a win two starts back”. The market splits them into a 5/2 favourite, two at 4s, and a tail of 8s and 16s.
Which of the obvious clues, if any, has actually paid in races like this?
In an earlier analysis of 35,767 chase turf handicap runners on soft going between July 2013 and March 2026, the answer was a quiet one. The race type as a whole was priced about right, and the familiar clues gave no obvious head start. That is useful to know, because it tells you where not to spend your effort.
These figures describe that stretch of racing. A different run of seasons would give slightly different numbers, so read them as a description of the past and not a forecast.
Which factors predict winners in chase handicaps on soft ground?
Across the 35,767 runners, about one runner in eight won, and the A/E ratio against Betfair SP was 1.00. A/E means actual winners divided by expected winners, where the expected number comes from the odds. At 1.00, the winners arrived at about the rate the prices suggested. No single blunt factor stood out from that. The sections below look at days since last run, course and distance form, class and trainer form.
What a 1.00 A/E tells you about this race type
Prices were converted to chances after removing the over-round, which is the bookmaker margin built into a market that makes the chances add up to more than 100%.
One win in eight looks low, but chase handicaps are big fields of evenly matched horses. That is what you would expect when eight or ten runners each carry a fair chance.
The point of the 1.00 is that high strike rates are not the same as value. Strike rate is simply how often something wins. A group of horses can win often and still be priced for it. If you want a refresher, the guide to the A/E ratio explained walks through the sum with an example.
For comparison, here are the verified figures for the main signals over all GB and Irish racing from 1 July 2013 to 14 October 2026, at Betfair SP with level stakes and 2% commission:
| Signal | Races or runners | Win rate | A/E | Return |
|---|---|---|---|---|
| Betfair SP favourite | 167,257 races | 34.4% | 1.00 | -1.4% |
| VDW Rank 1 (the horse our VDW rating system puts top in the race) | 153,920 races | 21.6% | 0.99 | -3.8% |
| Race Predictor top horse (the runner our Race Predictor model ranks first) | 167,314 runners | 25.5% | 1.01 | 0.0% |
These figures cover all race types and describe that period only, so they will not repeat exactly. They show the same thing as the soft chase slice: the obvious signals win a lot and break roughly even once the price is taken into account.
Days since last run in soft chase handicaps
Days since last run, often shortened to DSLR, is a natural thing to look at in jump racing. Horses are aimed at conditions, and a quick reappearance on suitable ground can be deliberate. The guide to DSLR covers the basics.
In the earlier analysis, the runners split like this:
| Days since last run | Runners | Win rate |
|---|---|---|
| 8 to 14 days | 3,487 | 13.7% |
| 15 to 28 days | 12,448 | 12.8% |
| 29 to 60 days | 10,963 | 12.5% |
| 61 to 90 days | 1,927 | 10.8% |
| 91 to 180 days | 1,639 | 9.3% |
| 181 days or more | 4,221 | 10.4% |
The pattern is gentle. Horses that ran within the last month won a little more often than horses returning after a long break. Quick returners did not form a standout group in this table.
Bands with fewer than about 1,000 runners are left out, because a small band can swing a long way on a handful of results.
Course and distance form on soft ground
Card readers love a “C&D” tag, meaning the horse has won at this course and over this distance before. The instinct is sound. Soft ground chasing can be course-specific, with some tracks suiting hold-up types, some suiting prominent jumpers, and some having an uphill finish that suits a particular profile.
In the earlier analysis:
| Previous win | Runners | Win rate |
|---|---|---|
| Course winner only | 2,149 | 13.2% |
| Distance winner only | 10,803 | 12.3% |
Both groups sit close to the overall rate of about one in eight. The win rates for a past course or distance win were close to the overall rate, so on these figures neither tag stood out on its own. The runners with both a course and a distance win were too few in this slice to quote, so they are left out.
The sensible use is as a small extra point in a runner’s favour once other things already support it. Our guide to course and distance winners looks at that over a wider set of races.
Class and trainer form
Win rates differ across the class ladder. In the earlier analysis:
| Class | Runners | Win rate |
|---|---|---|
| Class 1 | 2,455 | 7.3% |
| Class 2 | 2,948 | 11.2% |
| Class 3 | 8,256 | 14.0% |
| Class 4 | 10,381 | 14.4% |
| Class 5 | 6,474 | 12.4% |
Class 1 had the lowest win rate in this slice, and Classes 3 and 4 the highest. If class is new to you, the guide to racing classes explains the ladder.
Trainer form is often the first place readers look. In the same slice, trainers with a win rate above 20% over the previous fortnight had 7,769 priced runners and won 15.3% of the time. That is better than the overall rate, and the A/E of 1.01 means the prices had already allowed for it. A hot yard wins more often, and the odds reflected that.
Putting it together on a Saturday card
The overall A/E of 1.00 and the trainer figure suggest the market priced this race type about right, and the raw win rates for days since last run, course form and class showed only modest differences. A strong strike rate is not the same as an edge.
That does not leave you with nothing to do. It changes the job. Instead of asking which horse ticks the most boxes, ask whether your own read differs from the price on offer, race by race.
Here are a few ideas to test for yourself, not rules:
- Note which runners have come back within about a month, and see whether your own results from them hold up.
- Treat a course or distance win as a tiebreak between two similar horses.
- Compare your view of a horse with the price before you decide, and skip the race when you cannot find a reason to disagree with the market.
If you try any of these, keep a record. It helps you tell a short bad run from evidence that an idea is not holding up, and even a sound idea can have bad runs, so judge it over a decent number of races. The guide on testing a system live shows one way to do it without risking much.
The short version
Soft chase handicaps are competitive, and the race type as a whole was close to fairly priced in the earlier analysis. That makes them a good place to practise reading a race carefully and a poor place to expect a shortcut. Enjoy the puzzle, keep your stakes sensible, and judge your approach over a long run.
If you want to put this into practice on a wet Saturday, you can open today’s race cards and look at the chase handicaps with the going in mind.