
Get access to the PR and VDW ratings and find top-rated winners every day.

Find out which horse has been tipped by the most newspaper tipsters each day.
Stop doing all the hard work yourself and get access to daily tips.

Find out which horse is predicted to be the fastest horse.
Track horses, trainers and jockeys, get instant alerts when they're running and see how profitable you are using them.
Stop working out the results of your bets by hand. Simply add your bets each day and let us automatically show you the results.
Stratford - 12:25
Speed Ratings in Horse Racing: What Is It and How Do You Use It?
Also known as speed figures, speed ratings are numbers used to denote the ability of a horse on a given day.
There are different types of ratings and calculations which are all considered to be speed ratings, just different versions.
For a long time, the belief was that speed ratings were mainly useful in American racing and, given the uniqueness of the tracks, they couldn’t possibly work in UK and Irish racing.
Then most people believed that speed ratings only mattered in Flat and All-Weather.
Wrong again!
It turns out speed ratings are extremely useful in National Hunt racing too.
I place great importance on speed figures, while understanding that they’re another tool in my armoury rather than my sole weapon.
CONTENTS
- What Are Speed Ratings in Horse Racing?
- How to Calculate Speed Figures in Horse Racing
- How to Calculate the Standard Time in Horse Racing
- How To Use Speed Ratings in Horse Racing
- The Racing Post Topspeed Horse Racing Rating and How It Is Made
- How the Race Advisor calculates speed ratings
- What is the Difference Between a Pace Rating and a Speed Rating in Horse Racing?
- What are Sectional Timing in Horse Racing?
- Do speed ratings matter in horse racing?
- In Summary
What Are Speed Ratings in Horse Racing?
They are an estimate of how a horse is likely to perform in a race based on its previous runs.
The word ‘estimate’ is of the utmost importance here.
You are only predicting the horse’s likely performance with a speed rating before the race.
When you recalculate after the race, you will have a more accurate result, but it remains an estimate.
Regardless of what anyone tells you, a speed rating will never be completely accurate.
After all, you must consider various factors, including distance, weight carried, going, number of runners, track, race code, jockey, and the horse’s running style compared to others in the race.
Each criteria requires an estimate. Which means the accuracy reduces slightly with each estimate being used. Yet, this is essential, or else your ratings will be useless.
The smart play focuses on runners that have competed over similar conditions to today’s run.
Highlight horses that have fared well and have shown improvement or decline over the conditions.
Speed ratings involve taking the finishing time of a race, and then adjusting it to account for the number of lengths the horse is beaten by the winner (if it isn’t the winner) along with the weight it carried that day.
Unfortunately, trying to get a reliable set of speed ratings can be frustrating.
You’ll undoubtedly find many websites offering their figures, which vary drastically in accuracy.
What happens is that each website uses different “average times” for race meetings and distances; they may also have unique adjustments for going and weight.
Always remember, you can only calculate a speed rating after a race, once you calculate the average time for the meeting and distance.
All ratings provided before a race are a prediction of what the speed rating may be.
How to Calculate Speed Figures in Horse Racing
The truth is, there are many ways to try and calculate a horse’s speed rating.
In American racing, the benchmark remains the Beyer Speed Figures.
How this works is if a horse has achieved Beyer Speed Figures of 97, 99, and 104 in its last three races, it’s assumed that it is faster than a runner with figures of 89, 91, and 95 in its previous three races.
While it is worth understanding Beyer’s work, his speed figures don’t translate directly to British and Irish racing.
This is because in British and Irish racing you have to account for a number of factors that our American counterparts don’t.
The process of creating speed figures requires a fair bit of work.
I will begin by outlining a couple of the key elements in the process:
Calculating the Standard Time and Going Allowance.
How to Calculate the Standard Time in Horse Racing
You can only develop accurate speed ratings by creating standard times.
The key is to remember that the fastest horse doesn’t always win the race.
How often have you been left frustrated when the horse you were sure was the quickest fell prey to another runner and jockey who executed their tactical plan perfectly?
You’re about to find out why that happens!
Horses don’t win races in the first few furlongs, but they can lose them!
Most races are decided in the final 2-3 furlongs, particularly in sprint races. Sometimes the winner can emerge yards from the line.
You could argue that no two horse races are run the same. There are differences in conditions, courses, horses, jockeys, weather conditions, etc.
This makes it essential to create benchmarks to fall back on to compare finishing times more accurately.
Standard times are one such benchmark.
Standard Time Numbers in Horse Racing
Although it was first published in 2003, Nick Mordin’s Mordin on Time remains one of the best books on the subject of standard times.
Here’s one way of creating standard times outlined by Mordin:
- Get the finishing times of at least 20 races over your selected course and distance, such as 5f races at Ascot.
For simplicity’s sake, stick to races with good or faster going.
Mordin also recommends ignoring 2yo and 3yo races.
- Adjust your times for the race class. This makes the times of horses comparable across classes.
For Class 1 races, deduct 3.6 seconds per mile (8 furlongs) from the race time.
Here is how much you need to reduce the time per mile according to the classes:
- Class 1: 3.6 seconds
- Class 2: 4.8 seconds
- Class 3: 5.5 seconds
- Class 4: 6.3 seconds
- Class 5: 6.6 seconds
- Class 6: 6.9 seconds
- Class 7: 7.3 seconds
For example, in a Class 2 one-mile race at Ascot, you would take 4.8 seconds off the finish time.
When completing the finishing time task, write them down in descending or ascending order.
- Take the median time, NOT the average.
Using the median removes the outliers (extreme high and low) times out of your calculations as these can skew the results.
Well done, you are doing well and have got the starting figures that you need to calculate the standard times.
Now you must also adjust for the track’s turns and gradients.
Here is how you do that…
- Look at a course map and add 0.3 seconds per furlong for every turn in a spring race
- Decrease it to 0.2 seconds for longer sprints
- Don’t make any adjustments for races more than 10 furlongs (1.25 miles)
- Add 1.5 seconds per furlong for uphill sections
- Take away 0.5 seconds per furlong on downhill sections
Yes, it is a lot of work!
But if you use your speed ratings to make a profit, you’re going to be very happy with your efforts!
There’s a reason that a lot of people spend a lot of time calculating these numbers.
How to Calculate Going Allowance
The going allowance is another very important aspect of speed ratings.
The racetrack’s conditions have a major bearing on the speed of horses.
For example… races on heavy going will naturally be slower than those on fast going.
Rather than getting into a lengthy explanation of the going stick and moisture in the soil, it’s easiest to base the going allowance on standard times.
On each racetrack (or course) we look at the fastest races in events with experienced horses, and make a note of their finishing times.
We then compare these to the standard times for that racetrack.
Lastly, we average the difference between the quickest race times and the standard times to get our going allowance.
Working The Going Allowance Numbers
Pick a racecourse you want to find the going allowance for.
Check for the distance and race type you’re focusing on, and head to the Racing Post site to discover its standard time.
You should use the standard times you’ve calculated if you’ve already done so!
In our example we will take a 7 furlong race at Redcar with a standard time of 1:23 or 83 seconds.
The race we want to analyse was won in 86 seconds. This is a difference of 3 seconds from the standard time.
Working out what this difference is per mile gives us a difference of 3.43 seconds per mile. It is longer because 7 furlongs is shorter than a mile.
Repeat these steps for every Redcar race that day.
When you have this data you will be able to see if every race was run slower or faster than the standard time, and by how much.
Moving to the next step, we will assume all seven races that day were slower than the standard by between 1.8 and 11.7 seconds per mile.
Now we…
- Remove the races with the fastest and slowest times
- Take the average of the remaining five races
In our example we get an average of 4.5 seconds slower per mile.
We can now convert this figure into the average time for the race’s distance.
To work out the distance in miles, simply type into google “7 furlongs in miles” and it will give you the answer.
In the 7 furlong race this would mean multiplying 4.5 x 0.875 = 3.94 seconds.
The final step is to…
Take this number away from the actual winning time to get your going allowance figure.
In our 7 furlong race the winning time of 86 seconds becomes 82.06 seconds (86 – 3.94) after we have considered the going allowance.
When you do this for all the races you are analysing your speed ratings become more accurate and you can begin comparing ratings from races over different ground conditions.
How To Use Speed Ratings in Horse Racing
Once you’ve gathered your speed ratings, it’s time to unleash their power on unsuspecting bookmakers!
A good set of speed ratings will allow you to predict how horses who have never competed against one another will fare when they meet.
Some bettors even ignore form and other factors such as official ratings, and focus purely on speed figures.
I do NOT recommend this; I firmly believe your speed ratings should be one part of your analysis.
You should always go through the FMFR, or Five-Minute Form Reading, method (available in your free resources when you have logged into your Race Advisor account) before placing any bet.
It is also a good idea to look for unexposed horses. These are horses that we are unlikely to have seen the best performances yet because they haven’t had enough races or are too young to compete at higher classes.
When a horse wins or performs well the handicapper will increase its rating and ensure it carries more weight.
This means if a horse wins in fine style it may receive a 7-pound rise. Another good win means another 7 pound rise in the weight it’s carrying and suddenly it has to race with 14 pounds more than it did two races ago.
That’s going to make a big difference to its ability to race and its speed rating.
However, the horse in question will likely receive strong support from punters.
In this scenario, you should always consider horses with good speed ratings, with higher odds, that have so far escaped the handicapper’s grip, and speed ratings can help you identify the horses which are carrying too much weight and which are running faster than the market thinks.
You should also always look for good value odds on your bets in other markets aside from the win market!
It is almost always better to create your own speed ratings than use someone else’s because the process of creating them makes you very familiar with how they work and you will spot handicapper mistakes while you make them.
However, the time it takes to make them is prohibitive and is why you may want to use horse racing speed ratings made by others.
Obviously I’m biased and firmly believe the Race Advisor speed ratings are the best out there, but it would be remiss of me to write an article on speed ratings in UK horse racing and not mention the Racing Post’s Topspeed rating. This is the speed rating provided by the main horse racing newspaper in the country.
The Racing Post Topspeed Horse Racing Rating and How It Is Made
If you go to any Racing Post racecard, there will be a column which is labelled ‘TS.’
This stands for the publication’s Topspeed ratings.
The TS rating is measured in pounds and theoretically this should help reduce the effect of going and weather conditions.
We contacted the Racing Post to confirm how they make their rating, and they said:
- A ‘mature’ horse carrying 126 pounds (9 stone) with a 100 rating can meet the publication’s Standard Time on good going in a truly run race on Flat or All-Weather.
- The most relevant distance is 5 furlongs since the Racing Post calculates that a 1-second difference per 5f is the equivalent of 22 pounds
- A “mature” horse carrying 168 pounds (12 stone) and a 135 rating meets Standard Time in a truly run race on good going in National Hunt races.
- In NH races, a 1-second difference at 2 miles is the equivalent of 6 pounds.
Let’s take a quick look at how topspeed figures are calculated…
A TopSpeed Calculation Example
This example is going to use a class 1 race at Newbury which was run on Good going.
Noble Style finished the race third, three lengths behind the winner Shaquille.
The winning time for the 6 furlong distance was 70.49 seconds.
The Racing Post said this was fast by 0.01 seconds.
This means that the Standard Time for the race is 70.50 seconds.
According to the Racing Post, this is how they would calculate Noble Style’s TS rating.
- Distance (D): 6 furlongs = 1,320 yards
- Time of Winner (T): 70.49 seconds
- Beaten Distance (B): 9 yards; a length is defined as 3 yards, so Noble Style finished 3 lengths, or 9 yards, behind the winner
- Total Distance Covered (D2): 1311 yards; Noble Style finished 9 yards behind the winner, so he completed 1311 yards in 70.49 seconds.
- Speed (S): 18.62 (Divide T into D2)
- Time Behind Winner (T2): 0.48 seconds (Divide B into S)
- Comparison to Standard Time (C): +0.47 seconds (Subtract the time the winner was inside Standard Time from T2)
- Adjusted Comparison (A): +0.39 seconds (1100 x 0.47 = 517/1320) [Multiply 1100 (Since TS ratings are adjusted to 1100 yards) by C and divide by D in yards)
- Going Correction (G): 0 since the race took place on Good going
- G2: +0.39 seconds (Going Correction adjusted for 5 furlongs plus A)
- Pounds Equivalent of G2 (P): 8.58 (In flat races, 1 second at 5 furlongs is 22 pounds, so multiply 22 by G2)
- Weight Adjustment (W): -2 (Subtract Noble Style’s Race Weight of 9-2 from the 9-0 used by the RP)
The Racing Post used the following formula to calculate TS in flat races:
100 – W + WFA – 22(1100C/D + 5G)
For the record, WFA stands for Weight for Allowance. The Racing Post’s WFA works as follows:
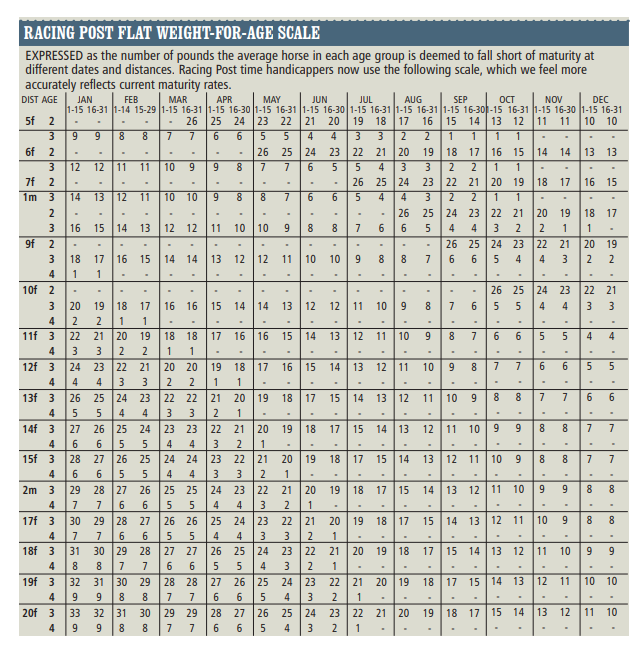
This table is included for reference. Don’t worry about figuring it out now, you don’t need to, it’s enough to make anybody’s brain ache!
What we do the 100–W+WFA part of the sum first:
100 – (-2) = 102
Great news… in this example there is no WFA to contend with 🥳
Therefore, we can go to this bit of the calculation 22(1100C/D + 5G) next:
22 * (1100 * 0.47 / 1320 + 5 * 0) = 5.39
Finally we do the last bit of the calculation where we subtract the first part from the last part:
102 – 5.39 = 96.61
We round it up to 97, which is Noble Style’s TS.
Problems with the Racing Post’s TS Horse Racing Speed Ratings
Punters pay a lot of attention to speed ratings in the United States because the tracks are all quite similar.
It’s a different story in the United Kingdom and Ireland where every courses is very different and you also have to contend with different going and surface types.
Even the distances differ because a 5 or 6 furlong can be different by a few dozen yards!
To make matters even more confusing, the adjusted TS rating focuses on the best rating in the last 12 months, and a lot can happen in 12 months in horse racing.
And it gets yet more complicated!
The adjusted TS speed rating doesn’t take the race distance into account!
This means if a horse races over 6 furlongs, you should focus on ratings related to previous 6 furlong races.
Please don’t make the mistake of thinking its TS rating of 85 in a 5 furlong race applies to its 6 furlong performances.
If it shows a lower TS rating over 6 furlongs, the extra furlong likely is too much for the horse to put in an optimal performance.
That said… you might want to pay attention to a high odds horse that’s suddenly well-backed when you find its adjusted TS rating is rather high.
How the Race Advisor calculates speed ratings
As you may have gathered, we like to go the extra mile in all of our data to make sure we’re providing you with the best horse racing speed ratings on the planet.
In order to calculate speed ratings for thousands of races every year, we needed to find a way to be able to calculate them automatically. This meant calculating accurate standard times and making adjustments without requiring human intervention in every single race.
How did we do it?
We started with standard times. First we realised that we needed to be able to calculate accurate standard times automatically. That meant we needed to be able to make the class and going adjustments automatic.
If the adjustments were fixed, then automating it wouldn’t be an issue. However our database goes back to 2013, and these adjustments won’t be consistent over a ten year period, they will have changed during that time and they will continue to change into the future.
That made our first step to create a process of re-calculating these allowances automatically every month.
When we’d done that, we needed to make sure we could calculate them all the way back to 2013.
The key in calculating historic horse racing data is to make sure that every time you run a calculation you only use data that would have been available at the time of the race you are calculating the data for.
This means if we are calculating the standard time allowances for races on the 17th September 2017, we are only using the data up to 16th September 2017. This makes the data accurate as it would have been at the time of the race, and it allows the data to be used for testing strategies effectively.
Once we had worked out the mathematics for the calculations, we then run these calculations monthly to make sure that our standard times are always being updated and that our speed figures are using the most accurate standard times possible.
With the standard times available, we are able to start looking at the calculations of speed ratings.
Before we look at that, there is also a rating used in other countries (although I don’t know anybody else using it in the UK) called energy ratings.
Energy ratings are calculations based on the type of energy a horse is burning at different stages in a race.
The two types of energy are aerobic and anaerobic. Anaerobic energy is stored in the muscles and blood glucose of the horse. Critically, there is no oxygen required for this energy.
Aerobic energy is created by the oxygen in the lungs. If the exercise of the horse is using more energy than is created by the oxygen in the lungs it begins to use the anaerobic energy stored in the muscles and continues to do that until those stores are empty and the horse is exhausted.
One of the most important factors in how energy is consumed is weight.
It is also one of the reasons that energy ratings are not used in UK and IRE horse racing very often.
In a lot of countries the weight of a horse has to be declared before a race.
Not in the UK and IRE!
This means assumptions need to be made around average weights of a horse, and these can be adjusted further using estimates of a horses weight, although estimates are much more generic than we would like, we work with what we have.
We combine both energy and speed ratings together in our final speed ratings. Before doing this we compared the performance of both ratings individually and combined, with the combination creating a higher level of prediction of performance, this is the route we chose to go.
While this article is not the place to go into advanced maths, you can read more in the one book I am aware of in the UK, called Bioenergetics in Horse Racing by Bob Wilkins. You can also find books on energy ratings in the US, and there are a number of academic papers around the energy use of a racehorse, for example The energy requirements of racehorses in training by Mark Ebert and Meriel J S Moore-Colyer.
If you delve into these, be prepared to get your hands dirty with advanced mathematics.
After every single race we calculate the speed ratings for each horse on the most up to date standard times we have.
We then use the paste speed ratings for each horse to calculate hundreds of speed based factors or every horse running.
Some of these are as simple as the speed rating in the horse’s last race. We then move to more complex ratings, such as adjusting the horse’s last speed figure to account for the weight in the race they are about to win (this is an awesomely affective rating). Even more ratings include speed averages over different numbers of races, timeframes, goings, distances and competitions.
Yes we adjust for some of these when we make the ratings, but any type of a horse race rating is just an estimate. It never harms to be able to see the ratings for a horse across different racing conditions to get confirmation of ability.
Our speed graphs are one of the most powerful tools in any horse racing fans betting arsenal. They take practice to use and time to implement, but they are probably the single most effective tool (combined with the FMFR Method) that you could ever have.
What is the Difference Between a Pace Rating and a Speed Rating in Horse Racing?
One of the best things you’ll ever do as a horse racing punter is to learn how to visualise races.
You can do this by analysing the likely race pace, which enables you to determine how a race will be run.
It’s important to understand how a race is likely to be run because this will allow you to assess the risk of your chosen horse being beaten. Assessing the risk of your horse being beaten will allow you to determine the minimum return you would like to achieve for the risk of it losing.
Horse pace is generally broken down into four categories.
The challenge to us horse racing fans is determining which category each horse is most likely to sit in.
When you have this information, you can solve the puzzle of how a race is likely to be run.
The four commonly used pace categories are:
- Leader: These runners start quickly and reach the front of the pack. Look for relatively short races with a single horse that likes to lead and is of reasonable quality. Be aware that in a race with several possible leaders, there’s a danger of some, or all runners, burning out as they jostle for the lead.
- Prominent: Also known as early pressers, these horses will sit close to the leaders or head the field if there are no front runners.
- Mid Division: As you can probably guess, these runners stay within the pack. The jockey will then pick a moment to strike and make a move.
- Held Up: These horses are also known as closers and stay near the back of the field. The jockey tries to preserve the runner’s energy and goes for the win close to the finish line.
As well as understanding the running style of each horse, you also need to determine the type of pace the race is likely to be.
This is dependent on the runners in the race!
A race filled with leader type horses is likely to produce a fast race.
In these races prominent or mid-division horses usually have a good chance, with the exception of races where there is a single dominant front-runner. Held-up horses often struggle to find the final push they need to win such a race.
Races with only one front-runner are known as ‘Lone Fast’ races.
If the leader in these races is a particularly strong horse, and isn’t challenged for the lead, it could easily dictate the pace and win the race.
However most races are ‘True Run’ affairs, and this often spells good news for prominent horses.
Lastly we have ‘Slow’ races, which are races that don’t have leaders or prominent horses. In these races you should be looking for held-up or mid-division runners, as their profiles usually perform best in these races.
In summary, a speed rating measures the speed a horse has run a race and a pace rating measures ‘how’ a horse has run a race.
What are Sectional Timing in Horse Racing?
Up until fairly recently, it was impossible to access sectional times for horse racing in the United Kingdom and Ireland.
Recently things have started to change. Although you can typically only access this information on a subscription basis.
If you watch racing on TV you may see times for each furlong pop up on the screen during the race.
A ‘section’ refers to a portion (or section) of a race.
For example… in a 5f race one section is the first furlong. Another section is from 1f to 2f and so on.
A sectional time is the amount of time it took a horse to run one section of a race.
Why are these good?
Because it allows you to determine how a horse likes to run a race far more accurately. You can see if they go fast at the beginning, slow in the middle and fast at the end, or if they go slower until the last section and then put on a burst of speed.
With this information you can predict more accurately the races that a horse is going to be most suited to from a pace perspective.
When you look at sectional times from races you often notice things you didn’t while watching the race.
For example, in a 5f race a highly favoured horse may run too quickly between the second and fourth furlongs and this loses them their victory.
If it ran those two furlongs in 23.76 seconds, meaning it could only manage 14.30 seconds for the last furlong. The winner may have run the second to fourth furlong in 25.20 seconds (significantly slower), but then managed to get a burst of speed and run the final furlong in just 12.57 seconds (faster) to get the win.
Alternatively, you may discover that two horses exerted far too much energy disputing the lead, making them vulnerable to strong finishers.
A quick check of the sectional times can reveal lots of hidden knowledge about a race and, more importantly, how a horse likes to race!
In both these examples you can compare the conditions of the unsuccessful races with today’s race to help you predict how the race will be run.
Perhaps one of the two front runners will enjoy an uncontested lead, giving them a better chance of holding off challengers.
Do speed ratings matter in horse racing?
Yes.
While it would be possible to leave this as my sole answer, I feel that it is important to give the reasoning behind it.
The best way to give the answer is to look at the statistics for various speed rating factors.
We have many speed based factors, but I am going to choose one which looks at the speed figure achieved in the last race and adjusts it to account for the weight being carried in today’s race.
I’m also going to focus on the rankings, with 1 or top rated being the best. Nuances of the actual scores can add yet more accuracy to analysis.
There will also be no race conditions. I am not filtering to exclude races where the horses have very little (or no) experience, such as novices. This is a blanket, all races from 2022 to the current date.
Horses ranked 1st for this factor lose just -1.75% ROI (return on investment) over 20109 runners.
To put this into context, favourites lose -2.83% ROI over the same period.
So already we can see a significant improvement in return.
Remember, we’ve done nothing more than consider the speed rating for the last race and adjusted it based on the weight the horse is carrying in today’s race.
Horses ranked 2nd for this factor made an ROI of +1.55% and horses ranked 3rd lost -6.56% ROI for the same period.
Again comparing this with the favourites over the same period, second favourites made a -3.74% ROI loss and third favourites made a -5.40% ROI loss.
There’s already a significant advantage on the top two ranked horses for the speed factor versus the favourites.
How about if we do a bit more. What about projecting what the next speed rating will be based on past speed ratings.
The top ranked horse for this rating made a +0.01% ROI, while horses ranked second and third made -5.00% ROI and +2.28% ROI respectively.
We could dig into why the second ranked horse for a projection made a loss while first and third made a positive return, but this is not the blog post to do that.
What we aiming to do here is to answer the question “Do speed ratings matter in horse racing?”
By looking at two of the simplest speed factors, one factor only taking into account the last race and the second factor projecting a future speed rating, we can already see there is an advantage of the market favourites.
Remember there is no race condition filtering happening, this is using all races available in the timeframe.
Once you begin using the FMFR Method, it starts to get even more impressive, and when you look at specific race conditions the game levels up again.
Bottom line… speed ratings are one of the most important factors to consider in horse racing analysis.
In Summary
If your mind is now reeling from the mathematics contained within this article, fear not!
Once you’ve created your own speed ratings once you’ll find the entire process easier.
There’s no two ways about it, creating your own speed ratings is a time-consuming process.
Whether it is a worthwhile way to spend your time is individual.
Most importantly, creating accurate speed ratings will undoubtedly improve your likelihood of winning.
You can also choose to go the route of having someone else make your speed ratings for you, and there are none better (in my hugely biased opinion) than the Race Advisor speed ratings.
Currently our speed ratings are only accessible by our Race Advisor Pro members, but we are in the process of making a dedicated speed area available on every single race card on the website.
Make sure you have created your free account to be notified when you can get access to our speed ratings.
presumably those who take your paid subscriptions are being advised to back different horses to the ones you tip on your free platform
Is that correct or are they exactly the same?
Hi Richard, the Race Advisor Pro Membership is currently on our Classic platform and contains tools and ratings, it does not provide tips but extensive and detailed tools to find your own selections. We are making a number of them available on the current website in an updated format. The next notable one will be the Monte Carlo Simulator for predicting races.
Hi Michael
I notice that on the WFA chart over 1 mile you have two lines for 3yo?
I presume the bottom line should not be there
Thanks , I had an older Chart which was a few pounds different on each section
I have in the past spent many hours forming my own speed ratings which I found extremely useful with 2yo’s so will very much look forward to buying your speed ratings in the future
Regards -Philip Oliver
Hi Philip, that chart is directly from the Racing Post, good spot. The answer is I am not sure but would assume the same as yourself.
Hi, Fascinating article. I do my own figures in a rough and ready way based on 6ths of a second instead of 5ths of a second per length and calculate going differences ie. 0.17 secs for gd to firm going, 0.2 secs for good going etc., finding them more accurate over sprint distances up to 8f….2yo races are tricky I must admit as differences can come down to fractions of a second and usually the market is a good guide but when you have unraced 2 yo’s to contend with I use pedigree as a guide rather than speed figures and, overall find the pedigree method more accurate so any plans to use pedigrees as a methodology i.e quantifiable information regarding breeding resulting in successful progeny from bloodlines as an example? Out of curiosity I would be interested to know if that is something you will be researching, or just not in line with how you assess potential winners in the unraced 2 yo category? Thanks for the article as very thorough information and which is very informative.
Great to hear that you are already using speed figures, and making your own. As you say 2yo races are tricky ones but agree that pedigree is a good way to go. It’s something that we have had on our radar to add as a feature for a while now. The primary reason it isn’t added yet is the data feed availability, but it is still something we are continually looking at the possibility of.