The PR Horse Racing Rating (stats)

There are two ratings available on the Race Advisor website, the PR (Power Rating) rating and the VDW (Van Der Wheil) rating.
You can access them by registering or logging in to your account.
To access these ratings for every race is just £2 per day, and you can access them on a day-by-day basis, with no subscription. You can also use our Premium Access for a monthly charge of £47 to get unlimited access to all our premium tools.
In this article we are going to investigate the PR rating to uncover how it performs under different race conditions.
The purpose is to enable you to find ways that you can use it to suit your own horse racing analysis and betting.
Contents
What do we use ratings for?
Before we begin using a horse racing rating, it’s important for us to understand what we use them. Without this knowledge we don’t know how to use them, and may both use them incorrectly and expect them to achieve the impossible.
Initially let’s debunk the horse racing myth that a rating should be able to make you a profit without any further analysis! There is no publicly available horse racing rating that can do this. If there were, the use of it would be so widespread that it would quickly be taken account of in the live betting markets and it would no longer make the profit.
Instead we aim for a rating to be a strong predictor of the performance of a racehorse in a specific horse race.
We are looking for the rating to support our analysis in finding those horses which are strong contenders and those which are not.
A strong contender is a horse that we expect to finish within 3 lengths of the winning horse. The horse does not have to win to perform well, but it must show us that it had a competitive advantage compared to the majority of the other horses in the race.
Knowing this, we are looking for a rating to be consistent. For the best rated horses to win the most races and the worst rated horses to win the least amount of races.
The winning rate does not relate to the profitability of a rating. A rating that finds the most winners, may have the worst profit, this is because it is finding horses where the odds are always significantly lower than they should be and so we can never make a profit from.
This in itself is useful information.
Everything in horse racing is about risk, and sometimes the best bets come from horses that are not the strongest but are still able to contend in a race, and whose odds are high enough to make it worthwhile the risk of betting them.
Using the Race Advisor ratings in combination with the FMFR Method (available free in your Race Advisor account) enables you to find the strongest horses in the race, and know whether the risk on each of them is suitable for you.
How we measure performance
In order to be able to determine where we may want to use a horse racing rating, we need to have a set of metrics that we measure it by. These metrics can be used in all examples and allow us to compare between different horse racing conditions to find out how best to use the rating.
We are going to be using the following metrics:
- No. Horses – The number of horses that have been found with the rating
- Win Rate – The winning percentage of horses with the rating
- Profit – The profit or loss of horses with the rating
- ROI – The return on investment for horses with the rating
- A/E – The average/expected tells us whether there is an advantage. Any figure over 1.00 means a positive advantage, backing to win might be considered and any number less than 1.00 means a negative advantage, laying to win might be considered
- Sel. Mth – The number of horses found on average per month for horses with the rating
- Est. Drawdown – The estimated largest drawdown over the timeframe set (1 year)
Initially we will be focusing on the Rank of the PR Rating. This means that 1 is the best rated horses, 2 is the second best rated horse, 3 is the third best rated horse.
We shall be focusing on the top five rated horses. Lower than this the winning rate starts to decline. There is value in looking at horses worse than this from a lay betting perspective, or if you are interested in high odds horses. If this is you, I urge you to do your own testing and research, you will not be disappointed.
In the future we will look at updating this article with additional information based around the rating scores as well as their rankings.
The PR Horse Racing Rating Baseline
Let’s begin our investigation by finding our baseline, a starting point for us to compare everything else with. This starting point contains horses in every single race for an entire year of racing in 2022. There are 13,119 races in this sample.
| PR Rank | No. Horses | Win Rate | Profit | ROI | A/E | Avg. Odds | Sel. Mth | Est. Drawdown |
| 1 | 13117 | 28% | –233.72 | -1.78% | 1 | 5.56 | 1093 | -518 |
| 2 | 13117 | 20% | 419.11 | 3.19% | 0.99 | 8.71 | 1093 | -449 |
| 3 | 13077 | 14% | 17.42 | 0.13% | 1.02 | 17.51 | 1090 | -581 |
| 4 | 12809 | 10% | -40.87 | -0.32% | 0.98 | 32.71 | 1067 | -622 |
| 5 | 12150 | 8% | -548.98 | -4.52% | 0.99 | 52.56 | 1013 | -661 |
The table above paints an interesting picture, one which shows us the rating is very predictive.
There are 10,462 winners in the top five ranked for the PR rating, which means 80% of all winners come from the top five rated horses.
We see a loss for horses top rated, then an increase in profitability for horses rated second and third, before it drops off on horses rated fourth and fifth best.
Looking at the A/E we can see a small advantage from a back to win perspective on the third best rated horses.
However, I am sure none of us would want to contend with the estimated drawdown by following these horses blindly. Since we’re not expecting to follow them blindly in every single race, that works fine.
We now have our baseline for which to compare against throughout the rest of the article.
The PR Horse Racing Rating by Race Types
We are going to break down the top five rated horses by the following race types to determine how best to use them to get an advantage. These figures are based on backing the horses to win, but there are other bet types available, when backing to win performs poorly it is possible that the back to place or the lay markets will be successful.
Flat All Weather (A.W.) Horse Racing
| PR Rank | No. Horses | Win Rate | Profit | ROI | A/E | Avg. Odds | Sel. Mth | Est. Drawdown |
| 1 | 2949 | 26% | -188.14 | -6.38% | 0.99 | 5.86 | 246 | -192 |
| 2 | 2949 | 19% | -47.70 | -1.62% | 1 | 8.79 | 246 | -181 |
| 3 | 2947 | 14% | -110.93 | -3.76% | 0.98 | 15.18 | 244 | -231 |
| 4 | 2933 | 10% | -359.35 | -12.35% | 0.96 | 28.01 | 238 | -417 |
| 5 | 2855 | 9% | -296.35 | -10.28% | 1.03 | 50.34 | 1013 | -392 |
There are 2,950 Flat All Weather horse races in our sample, and 2,292 winners in the top five ranked for the PR rating, which means 78% of all winners come from the top five rated horses in Flat All Weather horse racing.
Flat Turf Horse Racing
| PR Rank | No. Horses | Win Rate | Profit | ROI | A/E | Avg. Odds | Sel. Mth | Est. Drawdown |
| 1 | 4791 | 27% | -54.35 | -1.13% | 0.99 | 5.70 | 532 | -301 |
| 2 | 4791 | 19% | 864.68 | 17.67% | 0.99 | 8.44 | 532 | -166 |
| 3 | 4786 | 14% | 6.48 | 0.14% | 1.03 | 14.77 | 532 | -342 |
| 4 | 4722 | 11% | -86.01 | -1.82% | 1.01 | 26.97 | 525 | -354 |
| 5 | 4521 | 9% | 78.62 | 1.74% | 1.02 | 41.78 | 502 | -315 |
There are 4,791 Flat Turf horse races in our sample, and 3,763 winners in the top five ranked for the PR rating, which means 79% of all winners come from the top five rated horses in Flat Turf horse racing.
Chase Turf Horse Racing
| PR Rank | No. Horses | Win Rate | Profit | ROI | A/E | Avg. Odds | Sel. Mth | Est. Drawdown |
| 1 | 1935 | 29.56% | -1.08 | -0.06% | 1.01 | 4.98 | 161 | -158.08 |
| 2 | 1935 | 22.89% | -15.08 | -0.78% | 1.03 | 7.14 | 161 | -226.49 |
| 3 | 1907 | 15.94% | 84.12 | 4.41% | 1.02 | 12.87 | 159 | -226.11 |
| 4 | 1783 | 10.49% | -188.82 | -10.59% | 0.91 | 23.43 | 149 | -425.98 |
| 5 | 1549 | 8.46% | -111.95 | -7.23% | 0.9 | 35.33 | 129 | -384.64 |
There are 1,935 Chase Turf horse races in our sample, and 1,636 winners in the top five ranked for the PR rating, which means 85% of all winners come from the top five rated horses in Chase Turf horse racing.
Hurdle Turf Horse Racing
| PR Rank | No. Horses | Win Rate | Profit | ROI | A/E | Avg. Odds | Sel. Mth | Est. Drawdown |
| 1 | 2997 | 30.40% | -0.37 | -0.01% | 0.99 | 5.34 | 250 | -154.05 |
| 2 | 2998 | 19.11% | -338.23 | -11.28% | 0.93 | 10.26 | 250 | -382.33 |
| 3 | 2993 | 14.63% | 12.53 | 0.42% | 1.06 | 27.12 | 249 | -195.72 |
| 4 | 2928 | 9.77% | 276.22 | 9.43% | 1 | 52.73 | 244 | -128.89 |
| 5 | 2791 | 7.06% | -113.92 | -4.08% | 0.99 | 82.07 | 233 | -272.08 |
There are 2,998 Hurdle Turf horse races in our sample, and 2,405 winners in the top five ranked for the PR rating, which means 80% of all winners come from the top five rated horses in Hurdle Turf horse racing.
There are also 445 races from Bumper and Chase All Weather horse racing, Hunter Chase and NH Flat. From these 366 winners are in the top five ranked for the PR rating, which means 82% of all winners come from the top five rated horses in these races.
This gives us some very interesting information. Immediately we can see that, straight out of the box, All Weather Horse Racing provides the worst performance for the ratings. However, horses ranked 2 and 3 on All Weather racing only make a small loss. All the other race types have some rankings which make a profit (although I would not recommend following them blindly)
What do these results mean?
I tend to find it’s easier to understand horse racing ratings when we look at them visually, so… that’s exactly what we’re going to do.
Let’s begin by looking at the winning rates for each of our race types.
Race Type Analysis Winning Rate
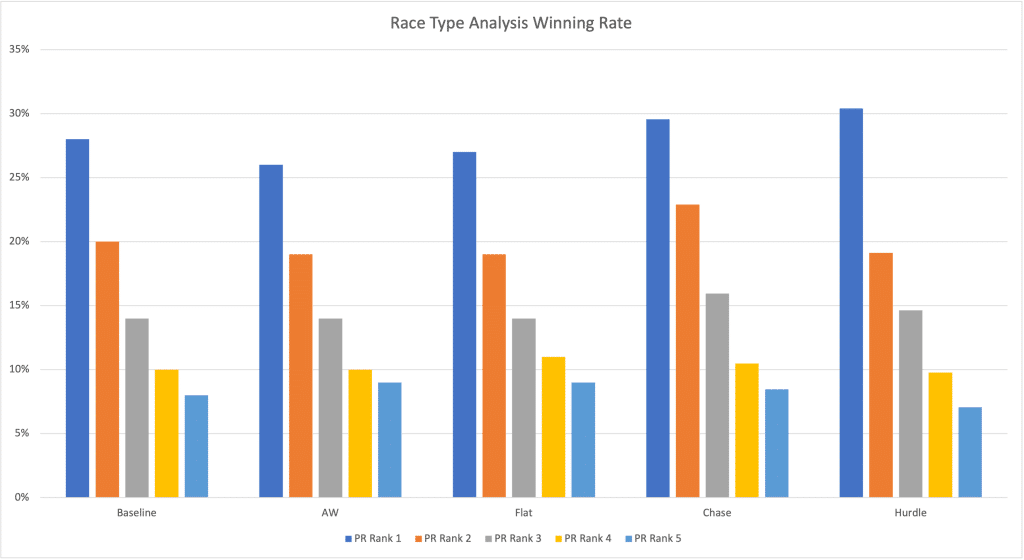
The first thing that is very important to take notice of is that we get a nice smooth curve of from the best rated to the worst rating (we are only considering the top five horses). This means the worse a horse is rated the less it wins.
The winning strike rate is pretty consistent to the baseline. The top ranked horse in Chase and Hurdle races slightly out-performs the baseline.
Race Type Analysis Profit
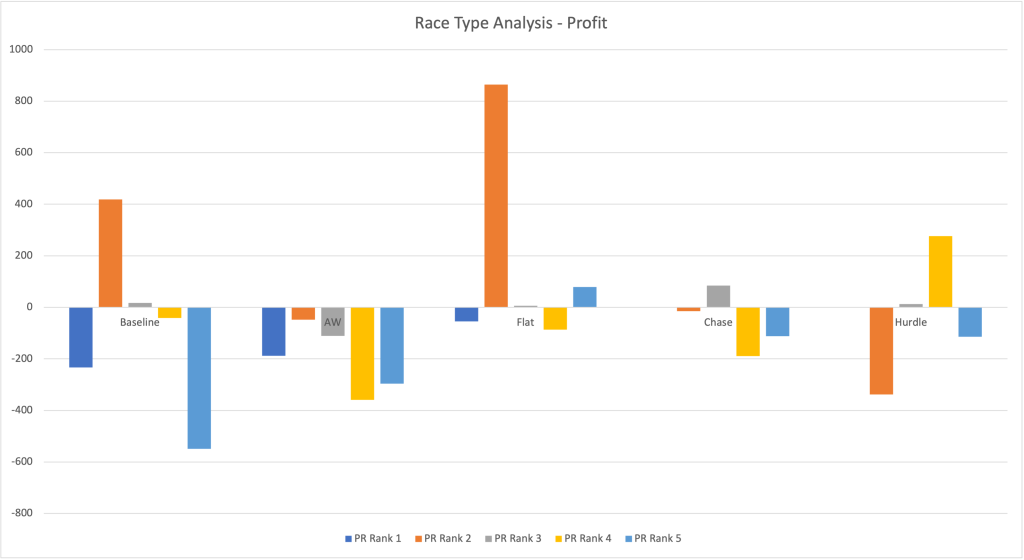
As you can see above, the second ranked horse makes a profit in our baseline, and in Flat horse racing this is significantly increased. Outside of this, the third ranked horse makes a profit in Hurdle racing and there are a few other small profits made elsewhere.
However, profit is not the best way to determine a good betting approach as it only shows a portion of the picture, a portion which is not very useful.
A better way is to use a combination of return on investment (ROI) and the A/E rating. Which is what we’re going to do now.
Race Type Analysis ROI
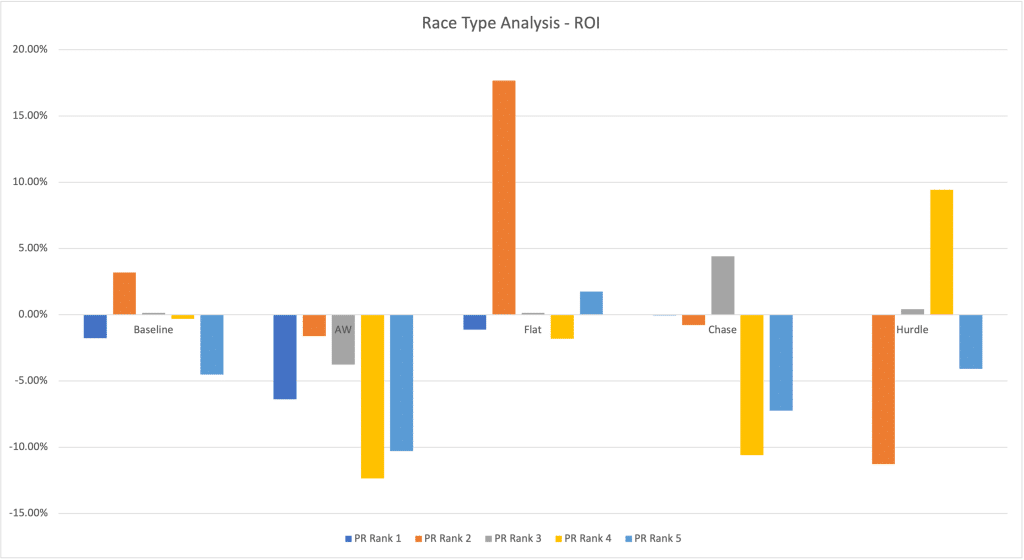
We start to see a much more interesting picture when we consider the ROI. The second ranked horse baseline doesn’t look quite so strong now, whereas the second ranked on Flat horse racing still looks very strong. Interestingly the ROI on Chase horse racing for the third ranked and Hurdle horse racing for the fourth ranked also look strong.
Race Type Analysis A/E
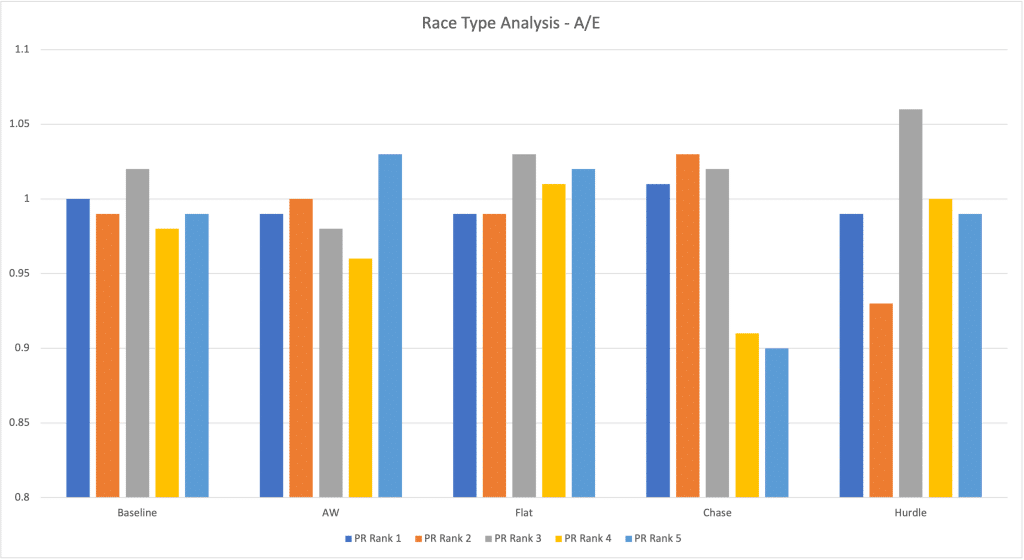
The A/E tells us the most interesting story. There is only one category, third ranked on Hurdle horse racing, where the horse has a high enough A/E to consider there to be a strong advantage. This is matched with a nearly 10% ROI.
IMPORTANT: I still do not recommend you start betting on all these horses, but they could be a very strong starting point to use the FMFR on if you don’t want to go any further.
But… I do recommend you go further, because we are only just starting to scratch the surface!
There are a number of groups of horses which showed a positive A/E figure (a number greater than 1) and all these have the potential to be made into profitable angles with a little bit more effort.
In this way we can use all the data together.
Now that we have some data, I want to show you how you should use it to determine a successful approach to follow. It’s easy to get it wrong, but it’s equally as easy to get it right. The next section looks at how to use data, and then we are going to come back to researching the other key areas of horse racing conditions.
How you should use data to win
Generally speaking, the go to that the majority of people use when determining if a horse racing betting method is going to work, are the profits.
But this is a mistake.
As you’ve seen above with the second ranked horses. It’s possible to have very high profits over a year, but when you look at the ROI it’s low, when you look at the A/E there is no real advantage (indicating that the profit is part of variance on a very high number of selections), and when you look at the potential downswing it’s pretty huge.
The fields you want to focus on are A/E and ROI (in that order).
When they are looking good together, you then want to focus on number of selections (are there enough, not enough or too many for you), and finally the downswings (indication of bankroll requirements and whether you are able to cope with the length of them).
For backing (win or place markets) we want the A/E to be above 1.05 to give us a big enough advantage to work with in the long-term. For laying (win or place markets) we want the A/E to be below 0.95, again giving us enough advantage to work with for the long-term.
Of course, the higher/lower this number is the stronger the advantage. But beware of numbers that are huge, while not always the case it can indicate that you have a very small number of horses, or that there have been wins by very high priced horses which are skewing the results.
When you find something suitable the next data point to look at is the ROI.
While most people look for ridiculously large numbers, you should be happy with anything over 5%. This is a very strong figure, and a good baseline to have as a long-term achievable return.
In fact, anything down to about -3.00% is possible to use, because with the FMFR method you can turn a small negative ROI into a good positive one. And I always recommend using the FMFR method before betting. If you don’t have a copy, then login/create your free account and head here.
When your ROI is satisfied, the next item to consider is whether there are too many, too few or the right amount of possible horses for you to consider betting on. If it’s right, then great, move ahead. If one of the other two then you need to do some more work by either narrowing down on stronger horses to reduce the number, or pulling back on your focus to increase the number. Always remember that when you implement the FMFR method you will not be betting on every possible horse, so this will also limit the number of horses you are betting on.
Finally we check the downswings. These is an estimated largest drawdown in bankroll over the timeframe you have been considering (it can be larger).
Your bankroll should be at least three times the size of this drawdown.
If that is too large for you, then you need to reconsider your approach. Sometimes it will mean starting again from the beginning, that’s okay, you want to spend the time now so you are comfortable when you hit that downswing.
Work out the estimated duration of the downswing.
If you have a downswing of 150 units, and your averaging 100 bets per month, then you know the downswing will last a minimum of six weeks (one and a half months). In reality it is likely to be at least twelve weeks, because in that downswing there will be winning bets, and it could be as long as three or four months.
Ask yourself if you didn’t reach a new high point in your bankroll for that period of time would you struggle to continue?
If you answer ‘yes’ then you need to go backwards a few steps and look for an approach that has a high winning rate, and possibly less horses (if you have a high volume of horses already).
This is how you measure and build a long-term successful approach to horse racing.
Now we’re going to get back to analysing the PR horse racing rating.
The PR Horse Racing Rating by Going
Next we are going to break down the top five rated horses by different goings to determine how best to use the ground to get an advantage. The going is the condition of the ground the horses are racing on and it can range from firm to heavy (very wet).
The following figures are based on backing the horses to win, but always remember there are other bet types available and when backing to win performs poorly it is possible that the back to place or the lay markets will be successful.
Horse Racing on Firm going
| PR Rank | No. Horses | Win Rate | Profit | ROI | A/E | Avg. Odds | Sel. Month | Est. Drawdown |
| 1 | 20 | 20% | -9.16 | -45.80% | 0.6 | 3.92 | 20 | -9 |
| 2 | 20 | 20% | 1.94 | 9.69% | 0.86 | 5.7 | 20 | -6 |
| 3 | 20 | 30% | 8.61 | 43.06% | 1.7 | 12.67 | 20 | -8 |
| 4 | 17 | 11.76% | -10.72 | -63.07% | 0.98 | 19.4 | 17 | -13 |
| 5 | 13 | 7.69% | -8 | -61.55% | 0.91 | 52.69 | 13 | -12 |
Despite smaller sample sizes, the PR rank 3 shows excellent performance with A/E of 1.70 and ROI of 43.06%. But you’d have to be very cautious until the sample size was bigger.
Horse Racing on Good to Firm going
| PR Rank | No. Horses | Win Rate | Profit | ROI | A/E | Avg. Odds | Sel. Mth | Est. Drawdown |
| 1 | 1527 | 28.49% | -72.55 | -4.75% | 0.99 | 4.9 | 222 | -88 |
| 2 | 1528 | 21.01% | -40.38 | -2.64% | 0.99 | 7.23 | 223 | -94 |
| 3 | 1522 | 14.65% | -28.26 | -1.86% | 1 | 13.93 | 222 | -79 |
| 4 | 1475 | 11.53% | 242.48 | 16.44% | 1.03 | 29.38 | 215 | -91 |
| 5 | 1354 | 9.16% | 331.73 | 24.50% | 1.04 | 39.73 | 197 | -111 |
There are notable performance from horses ranked 4th and 5th, with ROIs of 16.44% and 24.50% respectively, and a profit of +574.21 units. Both show good A/E values above 1.03, indicating reliable performance, across a good volume of horses. However, the win rate is very low, making the potential drawdowns significant.
Horse Racing on Good going
| PR Rank | No. Horses | Win Rate | Profit | ROI | A/E | Avg. Odds | Sel. Mth | Est. Drawdown |
| 1 | 4142 | 28.51% | -64.37 | -1.55% | 0.99 | 5.26 | 374 | -221 |
| 2 | 4141 | 19.54% | 579.54 | 14.00% | 0.95 | 9.1 | 374 | -226 |
| 3 | 4114 | 15.24% | 247.98 | 6.03% | 1.06 | 18.98 | 372 | -83 |
| 4 | 3973 | 10.80% | -37.88 | -0.95% | 1.03 | 34.62 | 359 | -197 |
| 5 | 3718 | 8.15% | -356.4 | -9.59% | 1 | 52.04 | 336 | -566 |
From 20,088 total horses, with strong performance from rank 2 horses showing a profit of +579.54 units and a positive ROI of 14%! Rank 3 horses also have an incredible profit of +247.98 with 6.03% ROI. The concern on horses ranked 2 is that the AE is just 0.95, indicating that they should not be winning as often as they are and we could expect a big swing in the other direction. However, horses ranked 3 show good reliability with an A/E of 1.06 and are going to be the ones best placed for your focus.
Horse Racing on Good to Soft going
| PR Rank | No. Horses | Win Rate | Profit | ROI | A/E | Avg. Odds | Sel. Mth | Est. Drawdown |
| 1 | 1547 | 29.93% | 110.74 | 7.16% | 1.07 | 5.51 | 130 | -63 |
| 2 | 1547 | 19.78% | -50.36 | -3.26% | 0.99 | 8.93 | 130 | -118 |
| 3 | 1545 | 13.66% | -89.29 | -5.78% | 0.96 | 20.59 | 130 | -199 |
| 4 | 1523 | 9.26% | -88.99 | -5.84% | 0.89 | 35.97 | 128 | -156 |
| 5 | 1422 | 9.21% | 310.07 | 21.80% | 1.1 | 59.93 | 119 | -89 |
Horses ranked 1 show particularly good profit of +110.74 and an ROI of 7.16%. With an A/E of 1.07 this also indicates that they are reliable and we can expect this performance to continue. Fifth ranked horses also made a good profit, ROI and A/E, but the win rate of just 9.21% is going to be too low for most bettors to be able to cope with.
Horse Racing on Good to Yielding going
| PR Rank | No. Horses | Win Rate | Profit | ROI | A/E | Avg. Odds | Sel. Mth | Est. Drawdown |
| 1 | 377 | 25.20% | 19.17 | 5.09% | 0.98 | 6.87 | 37 | -44 |
| 2 | 377 | 18.57% | -46.67 | -12.38% | 0.98 | 8.61 | 37 | -79 |
| 3 | 377 | 15.92% | 123 | 32.63% | 1.28 | 14.21 | 37 | -63 |
| 4 | 375 | 6.93% | -110.19 | -29.38% | 0.74 | 31.33 | 36 | -145 |
| 5 | 369 | 6.23% | 84.68 | 22.95% | 0.88 | 44.31 | 36 | -65 |
On good to yielding going, horses ranked 3 show exceptional reliability with A/E of 1.28 and strong ROI of 32.63%. The profit is also a healthy +123 units, and although the win rate is on the lower side at 15.92%, it’s still high enough for you to be able to prepare for downswings and losing streaks, if you are happy betting on outsider horses.
Horse Racing on Soft going
| PR Rank | No. Horses | Win Rate | Profit | ROI | A/E | Avg. Odds | Sel. Mth | Est. Drawdown |
| 1 | 1519 | 28.70% | -34.04 | -2.24% | 0.98 | 5.5 | 127 | -72 |
| 2 | 1519 | 21.46% | 126.62 | 8.34% | 1.08 | 8.45 | 127 | -84 |
| 3 | 1516 | 14.51% | -136.23 | -8.99% | 1.02 | 18.59 | 127 | -195 |
| 4 | 1488 | 10.01% | 385.05 | 25.88% | 0.98 | 34.7 | 124 | -186 |
| 5 | 1418 | 6.28% | -487.09 | -34.35% | 0.8 | 58.46 | 119 | -522 |
Although horses ranked fourth on soft going stand out with a 25.88% ROI and +385.05 unit profit, the A/E is less than 1, sitting at 0.98, and this gives us cause for concern as it indicates the profit should swing heavily back the other way. However, horses ranked two show good reliability with A/E of 1.08, a profit of +126.62, and a positive ROI of 8.34%.
Horse Racing on Soft to Heavy going
| PR Rank | No. Horses | Win Rate | Profit | ROI | A/E | Avg. Odds | Sel. Mth | Est. Drawdown |
| 1 | 110 | 32.73% | 17.56 | 15.97% | 1.14 | 5.44 | 9 | -15 |
| 2 | 110 | 18.18% | -30.74 | -27.95% | 0.95 | 9.51 | 9 | -49 |
| 3 | 110 | 14.55% | -1.92 | -1.75% | 1.09 | 14.52 | 9 | -16 |
| 4 | 110 | 4.55% | -61.41 | -55.83% | 0.49 | 22.87 | 9 | -81 |
| 5 | 107 | 4.67% | -37.71 | -35.24% | 0.69 | 83.5 | 9 | -60 |
This ground is great because horses ranked 1 show a good performance with an A/E of 1.14 and ROI of 15.97%, whilst winning 32.73% of the time. However, the number of horses bet on is quite small and so we’d need to be aware that there could be some changes here as more horses are followed that meet this criteria.
Having broken down the PR rating ranks by different ground conditions, what this tells us is that the performance is that horses ranked first on Good To Soft ground should be focused on as they have a high win rate, strong profit and ROI, whilst have a 7% advantage over the markets. Horse ranked second on soft ground should also be considered.
What do these results mean?
Let’s look at the results of our going analysis visually…
Going Analysis Winning Rate

When we look at the winning rate analysis visually, we can immediately see that the lower ranked a horse the less frequently it wins, which is exactly what we would expect.
While top ranked horses on soft to heavy going win slightly more frequently, more important to note is that those top ranked horses on firm going win significantly less frequently than other ground conditions.
Going Analysis Profit
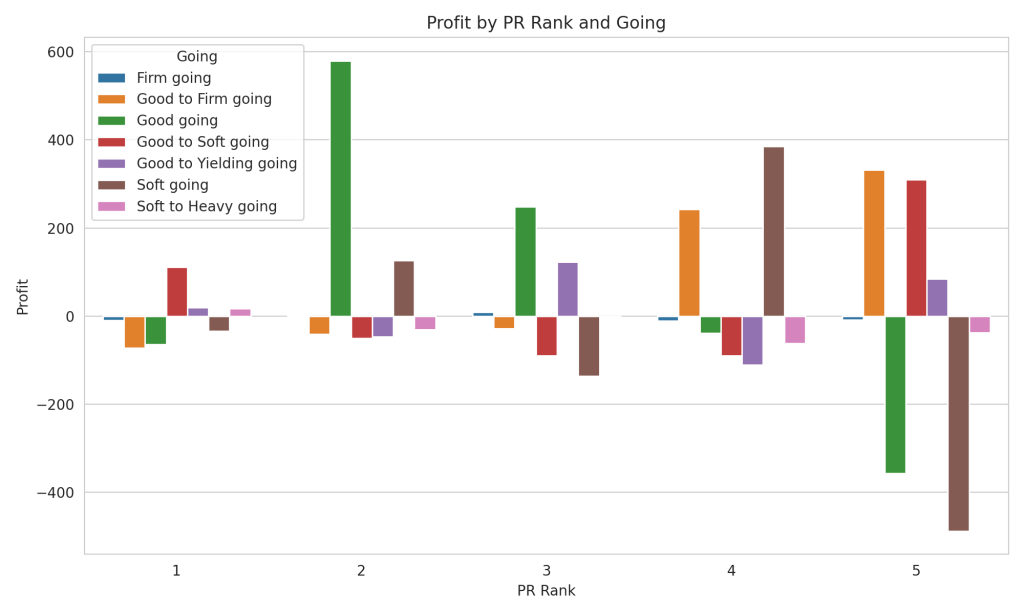
Our profit analysis is pretty stark in its results! Second ranked PR horses on good ground have made a huge profit. But it’s important to use all the analysis together, and we also know that these horses have an A/E of 0.95, meaning that they are winning less frequently than the odds suggest.
This is important, because it means we can expect a reversal on these results at some point in the future.
We can also see that there are significant losses made by horses ranked fifth on good and soft ground conditions.
Going Analysis ROI
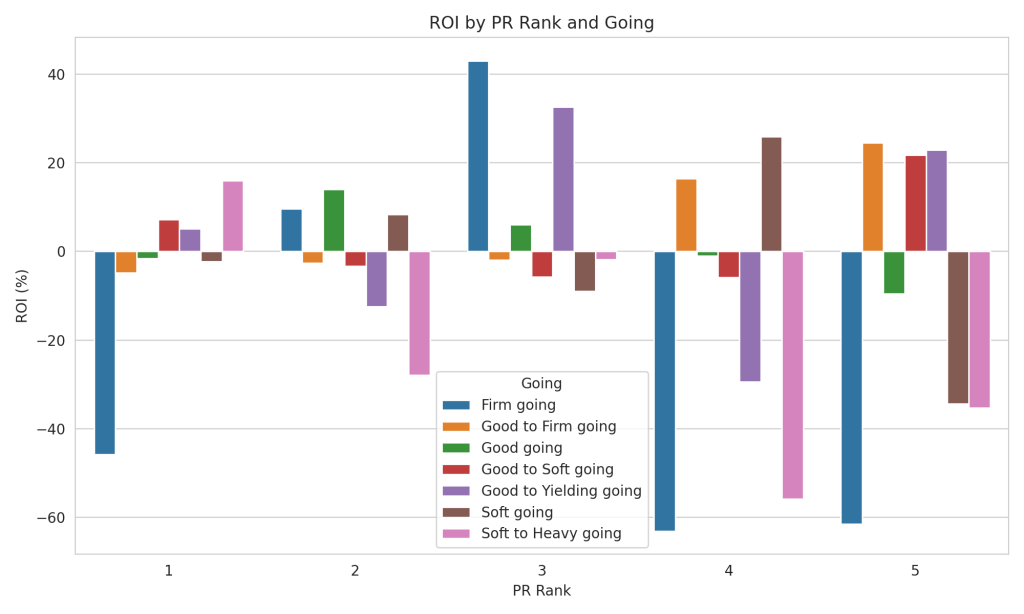
The ROI gives us a different picture to the profit analysis, and should be used alongside all the other analysis. Horses ranked third have made a good ROI on firm ground, but there were only 20 selections, so this information is skewed. Whereas on Good to Yielding there were a few hundred selections.
Do not focus on highest ROI only. Volume of selections is very important. A high volume of selections and a lower ROI can result in a greater profit. For example top rated horses on good to soft have a lower ROI, but there have been 1547 selections.
Getting the balance right is personal, and important for you to spend some time considering.
Going Analysis A/E
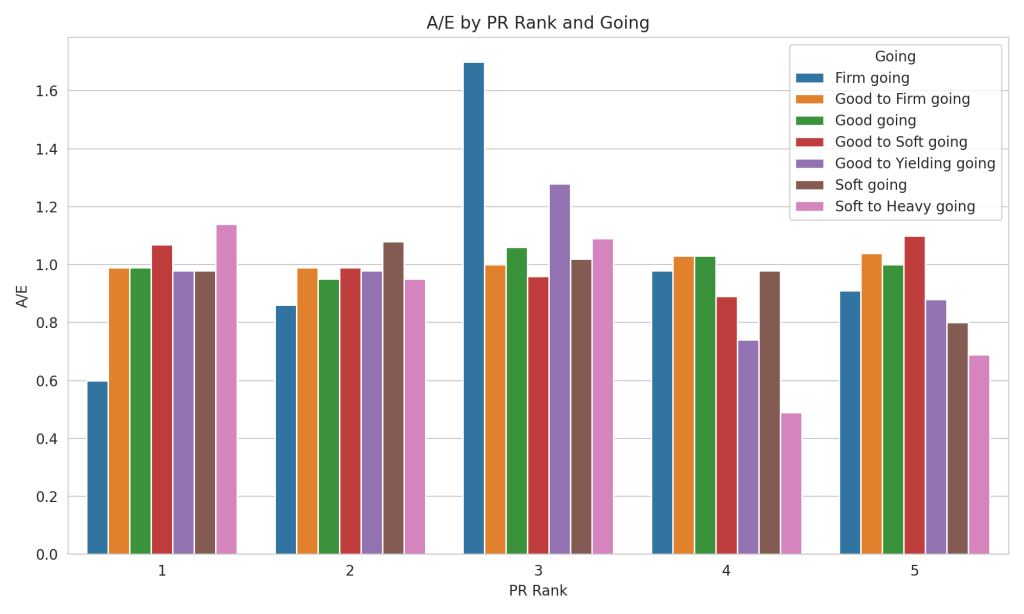
If you were to consider these different analysis points in isolation, which I strongly recommend you don’t, then the A/E is probably going to be the most important. It tells us if bets are winning more frequently than the odds suggest they should.
This is important because selections that are winning more frequently than the odds suggest tell us that there is value potential in the odds, and that the performance is more likely to continue.
Anything greater than 1 indicates horses are winning more often than they should, anything less than 1 indicates that they are winning less than their odds indicate they should. I would recommend only considering those areas where the A/E is 1.05 or higher, and if you are interested in lay betting, where the A/E is 0.90 or lower.
With this knowledge you can quickly see above that, with the exception of horses ranked fourth, there are opportunities for all the horses.
The PR Horse Racing Rating by Class
Horse Racing on Class 1
| PR Rank | No. Horses | Win Rate | Profit | ROI | A/E | Avg. Odds | Sel. Mth | Est. Drawdown |
| 1 | 745 | 37.18% | 66.76 | 8.96% | 1.44 | 3.87 | 62 | -34.41 |
| 2 | 745 | 19.06% | -118.21 | -15.87% | 1.29 | 6.75 | 62 | -131.65 |
| 3 | 742 | 13.75% | -32.28 | -4.35% | 2.36 | 17.14 | 62 | -93.15 |
| 4 | 732 | 11.07% | 47.82 | 6.53% | 3.85 | 34.78 | 61 | -104.5 |
| 5 | 674 | 6.23% | -167.82 | -24.90% | 3.52 | 56.53 | 56 | -168.99 |
This highlights the strength of Rank 1, which delivers a solid 37.18% win rate, +66.76 units profit, and an 8.96% ROI, making it the most reliable choice for consistent returns. Conversely, Rank 2 shows clear weaknesses with a -118.21 unit loss and -15.87% ROI, making it unsuitable for win bets but worth considering for place or lay strategies. Surprisingly, Rank 4 shines as a selective longshot option with a 6.53% ROI and +47.82 unit profit, despite a modest 11.07% win rate. For those seeking value, focusing on Rank 1 and selective bets in Rank 4 offers the best opportunities.
Horse Racing on Class 2
| PR Rank | No. Horses | Win Rate | Profit | ROI | A/E | Avg. Odds | Sel. Mth | Est. Drawdown |
| 1 | 710.00 | 24.65% | -15.45 | -2.18% | 1.34 | 5.44 | 59 | -60.14 |
| 2 | 709.00 | 19.32% | -23.11 | -3.26% | 1.52 | 7.85 | 59 | -60.06 |
| 3 | 708.00 | 14.41% | 12.70 | 1.79% | 1.78 | 12.39 | 59 | -111.75 |
| 4 | 689.00 | 12.05% | 212.10 | 30.78% | 2.40 | 19.96 | 57 | -65.43 |
| 5 | 647.00 | 9.58% | -60.11 | -9.29% | 2.89 | 30.12 | 54 | -131.59 |
In Class 2 races, Rank 4 horses are the clear standout, delivering an exceptional +212.10 units profit and a 30.78% ROI, supported by a strong A/E of 2.40. While their win rate of 12.05% is modest, their high average odds of 19.96 make them ideal for selective longshot bets. Conversely, Ranks 1 and 2 underperform, with negative ROIs of -2.18% and -3.26%, respectively, indicating limited value in backing these positions for win bets. Rank 3 shows potential with a small +12.70 units profit and 1.79% ROI, making it a secondary option worth consideration. Rank 5, however, struggles significantly, with a -9.29% ROI and a steep -60.11 units loss, best avoided for win betting.
Horse Racing on Class 3
| PR Rank | No. Horses | Win Rate | Profit | ROI | A/E | Avg. Odds | Sel. Mth | Est. Drawdown |
| 1 | 1,262.00 | 31.62% | 91.51 | 7.25% | 1.50 | 4.74 | 105 | -75.38 |
| 2 | 1,262.00 | 23.14% | -37.73 | -2.99% | 1.60 | 6.93 | 105 | -102.43 |
| 3 | 1,243.00 | 15.29% | -151.24 | -12.17% | 2.88 | 18.85 | 104 | -227.34 |
| 4 | 1,141.00 | 11.04% | -165.05 | -14.47% | 3.54 | 32.04 | 95 | -274.75 |
| 5 | 978.00 | 9.41% | -141.04 | -14.42% | 4.28 | 45.45 | 82 | -188 |
In Class 3 races, Rank 1 horses are the standout performers, with a 31.62% win rate, +91.51 units profit, and a 7.25% ROI, making them the most reliable for win betting. Their A/E of 1.50 supports their consistency, though a drawdown of -75.38 units suggests occasional patience is required. Rank 2 shows weaknesses, with a -2.99% ROI and a -37.73 unit loss, making it less attractive for win bets despite an A/E of 1.60. Lower ranks, particularly Rank 3, struggle with steep losses (-151.24 units) and volatile returns, although the A/E of 2.88 suggests rare value in speculative longshot bets. For reliable returns, focusing on Rank 1 is the safest strategy in this class.
Horse Racing on Class 4
| PR Rank | No. Horses | Win Rate | Profit | ROI | A/E | Avg. Odds | Sel. Mth | Est. Drawdown |
| 1 | 2,896.00 | 31.56% | 40.66 | 1.40% | 1.58 | 4.99 | 241 | -181.4 |
| 2 | 2,897.00 | 20.88% | -186.55 | -6.44% | 2.09 | 10.02 | 241 | -260.36 |
| 3 | 2,887.00 | 15.17% | 36.46 | 1.26% | 3.80 | 25.03 | 241 | -136.24 |
| 4 | 2,796.00 | 10.69% | 184.29 | 6.59% | 4.90 | 45.83 | 233 | -250.85 |
| 5 | 2,590.00 | 8.15% | 216.36 | 8.35% | 5.80 | 71.2 | 216 | -336.5 |
In Class 4 races, Rank 1 horses are dependable with a 31.56% win rate, a modest +40.66 units profit, and a 1.40% ROI, making them a solid choice for consistent returns. Rank 3, despite a lower 15.17% win rate, delivers a respectable +36.46 units profit and 1.26% ROI, making it worth considering for longshot bettors given its A/E of 3.80. Rank 5 stands out as a strong longshot option, achieving +216.36 units profit and 8.35% ROI, though its low 8.15% win rate suggests careful bankroll management is needed. Rank 2, however, is best avoided due to a -186.55 unit loss and -6.44% ROI, despite a reasonable 20.88% win rate.
Horse Racing on Class 5
| PR Rank | No. Horses | Win Rate | Profit | ROI | A/E | Avg. Odds | Sel. Mth | Est. Drawdown |
| 1 | 3,098.00 | 28.02% | -93.12 | -3.01% | 1.53 | 5.47 | 258 | -157.31 |
| 2 | 3,098.00 | 20.24% | 950.96 | 30.70% | 1.75 | 8.66 | 258 | -98.52 |
| 3 | 3,090.00 | 14.79% | -129.31 | -4.18% | 2.23 | 15.08 | 258 | -290.57 |
| 4 | 3,067.00 | 9.94% | 14.97 | 0.49% | 3.26 | 32.83 | 256 | -266.34 |
| 5 | 2,938.00 | 8.03% | -150.52 | -5.12% | 4.42 | 55.02 | 245 | -295.65 |
In Class 5 races, Rank 2 stands out as the clear winner, delivering an impressive +950.96 units profit and a 30.70% ROI, supported by a solid A/E of 1.75. While the win rate of 20.24% is modest, it offers excellent value for consistent returns. Conversely, Rank 1, despite a higher 28.02% win rate, produces a -3.01% ROI and a -93.12 unit loss, making it less appealing for win bets. Lower ranks struggle significantly, with Rank 3 losing -129.31 units and Rank 5 facing steep losses of -150.52 units despite their higher odds. For reliable profits in this class, Rank 2 offers the best opportunities.
Horse Racing on Class 6
| PR Rank | No. Horses | Win Rate | Profit | ROI | A/E | Avg. Odds | Sel. Mth | Est. Drawdown |
| 1 | 1,766.00 | 22.03% | -236.08 | -13.37% | 1.34 | 6.08 | 147 | -245.83 |
| 2 | 1,765.00 | 18.19% | 5.73 | 0.32% | 1.46 | 8.05 | 147 | -103.53 |
| 3 | 1,763.00 | 13.84% | 153.08 | 8.68% | 1.67 | 12.08 | 147 | -176.67 |
| 4 | 1,753.00 | 11.29% | 152.03 | 8.67% | 2.14 | 18.98 | 146 | -178.53 |
| 5 | 1,722.00 | 9.35% | -112.45 | -6.53% | 3.05 | 32.64 | 144 | -245.64 |
In Class 6 races, Rank 3 stands out with a profit of +153.08 units, 8.68% ROI, and a strong A/E of 1.67, making it the best option for longshot bettors. Similarly, Rank 4 offers a competitive +152.03 units profit and 8.67% ROI, supported by a high A/E of 2.14 and appealing average odds of 18.98. Rank 1, despite its 22.03% win rate, struggles with a significant -236.08 units loss and -13.37% ROI, making it unsuitable for win betting. Rank 2, while breaking even with a small +5.73 unit profit and 0.32% ROI, lacks strong profitability. Rank 5 performs poorly, with -112.45 units loss and -6.53% ROI, better avoided for consistent returns. Longshot backers should focus on Ranks 3 and 4 for the best value.
What do these results mean?
Let’s look at the results of our going analysis visually…
Class Analysis Winning Rate
PR Rank 1 is the most dependable choice for consistent win rates across all classes, particularly in higher-quality races like Class 1 and Class 3. PR Rank 2 offers secondary reliability, while Ranks 3, 4, and 5 are less consistent, highlighting their role as longshot opportunities rather than reliable win betting choices.
Class Analysis ROI
The graph emphasises that Rank 2 in Class 5 and Rank 4 in Classes 2 and 4 provide exceptional ROI opportunities. PR Rank 1 is reliable but lacks significant profitability, while PR Ranks 3 and 5 are better avoided in most cases. Use this insight to focus betting strategies on the most profitable ranks and classes.
Class Analysis Profit
PR Rank 2 (Class 5) and PR Rank 4 (Classes 2 and 4) are the most profitable combinations, while PR Ranks 3 and 5 underperform across most classes. PR Rank 1 provides stable win rates but does not consistently translate into strong profits, indicating its reliability but limited profitability.
Class Analysis A/E
The graph highlights that PR Ranks 4 and 5 offer the best opportunities for exceeding market expectations, particularly in classes with high odds like Class 2, Class 4, and Class 5. Conversely, PR Ranks 1 and 2 align closely with expectations, providing reliable but less value-oriented performance. Use this data to identify ranks with strong potential for high returns relative to market odds.
In summary
There are some unique opportunities across different classes, with each rank providing distinct strengths.
PR Rank 1 is highly consistent, delivering strong win rates in higher-class races like Class 1 and Class 3, where its win rate exceeds 30%. However, its profitability is limited, with low A/E values and modest or negative ROIs in some classes, such as Class 6.
On the other hand, PR Rank 2 thrives in selective scenarios, particularly in Class 5, where it produces remarkable profitability (+950.96 units) and an ROI of 30.70%.
PR Rank 4 and PR Rank 5 stand out as longshot options, with PR Rank 4 excelling in Classes 2, 4, and 5, where its profitability and A/E values are exceptional despite lower win rates.
PR Rank 3, however, shows weaker performance overall, offering limited value outside of occasional high-A/E classes.
To make profitable bets, focus on PR Rank 1 in higher-class races (Class 1 and Class 3) for stable, consistent returns.
For high-profit potential, target PR Rank 2 in Class 5 and PR Rank 4 in Classes 2 and 4, where they deliver incredible returns against market expectations.
Use PR Ranks 4 and 5 selectively for longshot opportunities in classes with high A/E values, but avoid over-reliance on PR Rank 3 or 5 for win bets.
A balanced strategy focusing on PR Rank 1 for reliability and PR Ranks 2 and 4 for profitability is the best approach. Additionally, lay bets against weaker ranks, such as PR Rank 5 in Class 6, can further enhance returns while minimising risks.
The PR Horse Racing Rating by Runners
Horse Racing on a Small Field (2-8)
| PR Rank | Total Races | Win Rate | Profit | ROI | A/E | Avg Odds | Sel. Mth | Est. Drawdown |
| 1 | 4,836.00 | 34.90% | 103.41 | 2.10% | 1.00 | 3.79 | 403 | 242 |
| 2 | 4,836.00 | 24.70% | -32.92 | -0.70% | 0.99 | 6.46 | 403 | 242 |
| 3 | 4,796.00 | 17.50% | 442.14 | 9.30% | 1.05 | 17.15 | 400 | 240 |
| 4 | 4,526.00 | 11.50% | 439.41 | 9.80% | 0.99 | 33.43 | 377 | 226 |
| 5 | 3,869.00 | 8.70% | -74.64 | -1.90% | 1.01 | 55.47 | 322 | 193 |
In small fields, Rank 3 and Rank 4 horses show exceptional profitability, with Rank 3 generating a +442.14 units profit, 9.30% ROI, and a 17.50% win rate, while Rank 4 delivers a similar +439.41 units profit, 9.80% ROI, and an 11.50% win rate, making them ideal for longshot strategies. Rank 1 offers reliability with the highest 34.90% win rate and a modest +103.41 units profit, although its 2.10% ROI suggests limited upside. Rank 2 and Rank 5 struggle, with losses of -32.92 units and -74.64 units, respectively, making them less attractive for win bets despite occasional surprises at higher odds. Focus on Ranks 3 and 4 for strong returns in small fields.
Horse Racing on a Medium Field (9-11)
| PR Rank | Total Races | Win Rate | Profit | ROI | A/E | Avg Odds | Sel. Mth | Est. Drawdown |
| 1 | 2,700.00 | 26.80% | 13.74 | 0.50% | 1.00 | 5.34 | 225 | 135 |
| 2 | 2,699.00 | 18.40% | 784.43 | 29.20% | 0.95 | 9.18 | 225 | 135 |
| 3 | 2,698.00 | 15.40% | 92.10 | 3.40% | 1.06 | 15.2 | 225 | 135 |
| 4 | 2,699.00 | 10.70% | -120.33 | -4.50% | 0.99 | 28.77 | 225 | 135 |
| 5 | 2,698.00 | 9.20% | -145.70 | -5.40% | 1.04 | 47.07 | 225 | 135 |
In medium fields, Rank 2 horses excel with a 29.20% ROI and a remarkable +784.43 units profit, making them the most profitable choice despite a modest 18.40% win rate. Rank 3 offers steady performance with a 3.40% ROI, +92.10 units profit, and an A/E of 1.06, appealing to longshot backers. Rank 1 shows reliability with the highest 26.80% win rate and a small +13.74 units profit, though its 0.50% ROI limits its appeal. Lower ranks struggle, with Rank 4 and Rank 5 showing losses of -120.33 units and -145.70 units, respectively, making them best avoided for win betting. Focus on Ranks 2 and 3 for consistent returns in medium fields.
Horse Racing on a Large Field (12-14)
| PR Rank | Total Races | Win Rate | Profit | ROI | A/E | Avg Odds | Sel. Mth | Est. Drawdown |
| 1 | 3,151.00 | 25.10% | 104.89 | 3.30% | 1.05 | 6.22 | 263 | 158 |
| 2 | 3,153.00 | 17.20% | 49.59 | 1.60% | 1.01 | 9.68 | 263 | 158 |
| 3 | 3,151.00 | 12.00% | -37.70 | -1.20% | 0.97 | 17.6 | 263 | 158 |
| 4 | 3,151.00 | 9.70% | 12.70 | 0.40% | 0.99 | 32.36 | 263 | 158 |
| 5 | 3,151.00 | 7.40% | 97.75 | 3.10% | 0.95 | 53.51 | 263 | 158 |
In large fields, Rank 1 delivers the most consistent returns, achieving a 25.10% win rate, +104.89 units profit, and a 3.30% ROI, making it a reliable choice for bettors. Rank 5 surprisingly posts a strong +97.75 units profit and a 3.10% ROI, though its low 7.40% win rate and high odds suggest it suits longshot backers. Rank 2 offers moderate profitability with +49.59 units and a 1.60% ROI, while Rank 3 and Rank 4 struggle, with Rank 3 posting a -1.20% ROI and -37.70 units loss. For strong returns, focus on Rank 1 for reliability and Rank 5 for speculative value.
Horse Racing on a Very Large Field (15+)
| PR Rank | Total Races | Win Rate | Profit | ROI | A/E | Avg Odds | Sel. Mth | Est. Drawdown |
| 1 | 2,435.00 | 19.40% | -197.21 | -8.10% | 0.93 | 8.27 | 203 | 122 |
| 2 | 2,433.00 | 14.50% | -137.84 | -5.70% | 0.99 | 11.44 | 203 | 122 |
| 3 | 2,433.00 | 10.60% | -213.35 | -8.80% | 0.98 | 20.46 | 203 | 122 |
| 4 | 2,433.00 | 8.40% | 54.69 | 2.30% | 0.97 | 35.68 | 203 | 122 |
| 5 | 2,433.00 | 7.00% | -44.63 | -1.80% | 0.99 | 52.66 | 203 | 122 |
In very large fields, Rank 4 is the only profitable option, achieving a modest +54.69 units profit and a 2.30% ROI, despite its low 8.40% win rate and high odds (35.68 average), making it suitable for longshot backers. All other ranks post losses, with Rank 1 showing the highest 19.40% win rate but struggling with -197.21 units and an -8.10% ROI. Rank 2 also underperforms, with -137.84 units loss and a -5.70% ROI, while Rank 3 and Rank 5 face steep losses of -213.35 units and -44.63 units, respectively. For bettors targeting very large fields, Rank 4 offers the best value.
What do these results mean?
Let’s look at the results of our going analysis visually…
Number of Runners Analysis Winning Rate
Rank 1 dominates in win rates, achieving 34.90% in small fields and consistently staying above 25% in most field sizes. Ranks 2 and 3 show decent win rates in medium and small fields but struggle in larger fields. Ranks 4 and 5 exhibit low win rates below 10%, relying on higher odds to deliver value despite their poor consistency.
Number of Runners Analysis ROI Rate
This graph highlights Rank 2 in medium fields as the best-performing combination with a stellar ROI of 29.20%. Ranks 3 and 4 in small fields also deliver strong ROIs of 9.30% and 9.80%, respectively, making them attractive for longshot bets. Larger fields show diminishing returns, with Ranks 3 and 5 posting negative ROIs, reinforcing their unsuitability in these scenarios.
Number of Runners Analysis Profit Rate
The graph shows that PR Ranks 3 and 4 in small fields are highly profitable, each delivering over +400 units of profit, while Rank 2 in medium fields outshines all others with +784.43 units. Rank 1 offers moderate profits in small and large fields but struggles in very large fields. Ranks 3 and 5 consistently post losses in larger fields, making them less viable for win betting.
Number of Runners Analysis A/E Rate
The A/E graph indicates that most ranks align closely with market expectations, with values around 1. Rank 3 in small fields slightly exceeds expectations with an A/E above 1.05, offering longshot potential. Larger fields see lower A/E values across ranks, particularly for Ranks 3 and 5, highlighting underperformance in these scenarios relative to market odds.
In summary
The charts reveal that Rank 1 is the most reliable option for achieving high win rates, particularly in small fields (34.90%) and large fields (25.10%), making it ideal for users seeking consistent returns.
However, its modest profits and ROI suggest that it should be paired with more targeted strategies for profitability. For users focused on high profits, Rank 2 in medium fields is a standout performer with an exceptional ROI of 29.20% and +784.43 units of profit, while Ranks 3 and 4 in small fields also excel, each delivering over +400 units of profit and ROIs near 10%. These combinations strike a balance between profitability and reasonable win rates.
In larger and very large fields, the data advises caution. While Rank 5 in large fields provides occasional longshot value with a 3.10% ROI and +97.75 units of profit, its low win rate (7.40%) requires careful bankroll management.
Rank 4 in very large fields is the only profitable option with a modest ROI of 2.30%, highlighting its potential in high-odds scenarios. Users should prioritise Rank 1 for reliability in smaller fields, Rank 2 in medium fields for profitability, and Ranks 3 and 4 in small fields for longshot opportunities, while avoiding lower ranks in large and very large fields where losses dominate.
This strategic focus balances win rates with profit potential for optimal results.
The PR Horse Racing Rating by Distance
Horse Racing in a Sprint (5f-7f)
| PR Rank | No.Horses | Win Rate | Profit | ROI | A/E | Avg. Odds | Sel. Mth | Est. Drawdown |
| 1 | 3245 | 25.80% | -215.86 | -6.70% | 0.98 | 6 | 271.4 | |
| 2 | 3245 | 18.40% | 792.48 | 24.40% | 0.98 | 9 | 271.4 | 46 |
| 3 | 3239 | 14.30% | 279.32 | 8.60% | 1.04 | 15 | 270.9 | 59 |
| 4 | 3203 | 11.60% | 177.08 | 5.50% | 1.09 | 25 | 267.9 | 72 |
| 5 | 3126 | 8.20% | 117.25 | 3.80% | 0.98 | 44 | 261.4 | 96 |
For sprints, Rank 2 dominates with an exceptional +792.48 units profit and a 24.40% ROI, making it the clear focus for consistent returns despite a moderate 18.40% win rate. Rank 3 also performs well, generating +279.32 units profit and an 8.60% ROI, supported by an A/E of 1.04 and appealing average odds of 15. Lower ranks, Rank 4 and Rank 5, deliver smaller but respectable profits of +177.08 units and +117.25 units, respectively, with longshot potential given their higher odds. Rank 1, despite a strong 25.80% win rate, posts a significant -215.86 unit loss and a -6.70% ROI, making it unsuitable for win betting. Focus on Ranks 2 and 3 for the best opportunities in sprint races.
Horse Racing in a Mile (7f-1m2f)
| PR Rank | No.Horses | Win Rate | Profit | ROI | A/E | Avg. Odds | Sel. Mth | Est. Drawdown |
| 1 | 3248 | 27.60% | 163.04 | 5.00% | 1.02 | 6 | 271.6 | 30 |
| 2 | 3243 | 19.60% | 74.89 | 2.30% | 1 | 8 | 271.2 | 43 |
| 3 | 3239 | 13.60% | -121.11 | -3.70% | 0.98 | 15 | 270.9 | 63 |
| 4 | 3209 | 9.60% | -262.9 | -8.20% | 0.9 | 30 | 268.4 | 88 |
| 5 | 3089 | 8.60% | -161.07 | -5.20% | 1.06 | 50 | 258.3 | 93 |
In mile races, Rank 1 is the standout performer, delivering a strong 27.60% win rate, +163.04 units profit, and a 5.00% ROI, making it the most reliable option for consistent returns. Rank 2 offers moderate profitability with a +74.89 units profit and a 2.30% ROI, though its 19.60% win rate is lower. Ranks 3, 4, and 5 all struggle, posting significant losses of -121.11 units, -262.90 units, and -161.07 units, respectively, with negative ROIs. Focus on Rank 1 for reliability and Rank 2 for secondary opportunities in mile races.
Horse Racing in a Middle (1m2f-2m1f)
| PR Rank | No.Horses | Win Rate | Profit | ROI | A/E | Avg. Odds | Sel. Mth | Est. Drawdown |
| 1 | 3257 | 30.40% | -86.13 | -2.60% | 0.99 | 5 | 272.4 | 26 |
| 2 | 3254 | 20.50% | -91.48 | -2.80% | 0.98 | 9 | 272.1 | 40 |
| 3 | 3245 | 15.00% | -53.68 | -1.70% | 1.04 | 23 | 271.4 | 56 |
| 4 | 3172 | 10.00% | 81.51 | 2.60% | 0.98 | 44 | 265.3 | 80 |
| 5 | 2982 | 8.20% | -11.1 | -0.40% | 1.05 | 62 | 249.4 | 98 |
In middle-distance races, Rank 4 is the only profitable tier, delivering +81.51 units profit and a 2.60% ROI, despite a low 10.00% win rate, making it suitable for longshot strategies. Rank 1, while achieving the highest 30.40% win rate, incurs a -86.13 unit loss and -2.60% ROI, making it unreliable for consistent returns. Rank 2 and Rank 3 also show losses of -91.48 units and -53.68 units, respectively, with negative ROIs. Rank 5, while posting a minimal -11.10 unit loss, has a poor 8.20% win rate, limiting its appeal. For middle distances, focus on Rank 4 for speculative value.
Horse Racing in a Long (2m1f+)
| PR Rank | No.Horses | Win Rate | Profit | ROI | A/E | Avg. Odds | Sel. Mth | Est. Drawdown |
| 1 | 3313 | 28.70% | 163.78 | 4.90% | 1 | 5 | 277.1 | 28 |
| 2 | 3315 | 20.60% | -112.62 | -3.40% | 0.98 | 8 | 277.2 | 41 |
| 3 | 3292 | 15.10% | 178.65 | 5.40% | 1.04 | 17 | 275.3 | 56 |
| 4 | 3150 | 10.30% | 390.77 | 12.40% | 0.97 | 31 | 263.4 | 78 |
| 5 | 2892 | 7.50% | -112.28 | -3.90% | 0.9 | 54 | 241.8 | 106 |
In long-distance races, Rank 4 shines as the most profitable option with a +390.77 units profit and an outstanding 12.40% ROI, despite its low 10.30% win rate, making it ideal for longshot strategies. Rank 3 also performs well, delivering a +178.65 units profit and a 5.40% ROI, supported by an A/E of 1.04. Rank 1 offers reliability with the highest 28.70% win rate and a respectable +163.78 units profit and 4.90% ROI. However, Rank 2 and Rank 5 struggle, both posting losses of over -112 units and negative ROIs. Focus on Rank 4 for speculative bets and Rank 1 for consistent returns.
What do these results mean?
Let’s look at the results of our going analysis visually…
Distance Analysis Winning Rate
Rank 1 consistently leads in win rates across all distances, achieving its highest rates in mile (27.60%) and middle (30.40%) races. Rank 2 offers respectable win rates, particularly in sprints and miles, but drops in consistency for long and middle distances. Ranks 4 and 5 maintain low win rates across all distances, relying on high odds for profitability.
Distance Analysis ROI Rate
Rank 2 in sprints as the top performer with an impressive ROI of 24.40%. Rank 4 in long distances also achieves a standout ROI of 12.40%, indicating strong longshot value. Rank 3 in sprints performs well with an ROI of 8.60%, supported by reasonable win rates. However, most ranks show negative ROIs in middle distances, emphasizing limited profitability in these races.
Distance Analysis Profit Rate
The graph shows Rank 2 in sprints delivers exceptional profitability, generating +792.48 units, significantly outperforming all other combinations. Rank 4 in long distances also excels with +390.77 units, ideal for longshot strategies. Rank 1 in mile and long distances provides moderate profits (+163.04 and +163.78 units, respectively) alongside high win rates. Ranks 3 and 5 perform poorly in most distances, with significant losses in mile and middle-distance races.
Distance Analysis A/E Rate
A/E values for most ranks hover around 1, indicating alignment with market expectations. Rank 3 in sprints slightly exceeds expectations (A/E 1.04), and Rank 4 in long distances shows value (A/E 0.97) despite low win rates. Rank 1 in mile races aligns closely with its strong win rates, supported by an A/E of 1.02.
In summary
The charts highlight distinct opportunities for users to focus on specific PR Ranks and distances for optimal win rates and profitability.
Rank 1 is the most reliable for achieving high win rates, particularly in mile (27.60%) and middle distances (30.40%), where its consistency shines. It also provides solid profits in long distances (+163.78 units), making it a great choice for those seeking stability.
However, Rank 2 in sprints is the standout performer for profitability, generating an exceptional +792.48 units and a 24.40% ROI, offering consistent returns despite a moderate 18.40% win rate.
For longshot strategies, Rank 4 in long distances stands out with +390.77 units profit and a 12.40% ROI, despite a low 10.30% win rate, making it an ideal choice for speculative bets.
Rank 3 in sprints also delivers strong value, with an 8.60% ROI and +279.32 units, supported by an A/E of 1.04.
Users should avoid middle distances, where most PR Ranks struggle to achieve positive returns, and exercise caution with Ranks 3 and 5, which consistently underperform across most metrics.
Focus on Rank 1 for reliability, Rank 2 in sprints for high profitability, and Rank 4 in long distances for longshot opportunities to achieve the best balance of win rates and profits.
In Conclusion
The PR Horse Racing Rating provides a versatile tool to target both high win rates and strong profitability across various races. For consistent returns, Rank 1 is the most reliable, particularly in mile and middle distances, where it boasts win rates of 27.60% and 30.40%, respectively, and delivers steady profits in long-distance races (+163.78 units). This makes it a dependable choice for bettors prioritizing stability. For those seeking maximum profitability, Rank 2 in sprints stands out as the best performer, with an exceptional +792.48 units profit and a 24.40% ROI, offering consistent returns despite a moderate 18.40% win rate.
Longshot backers should focus on Rank 4 in long-distance races, which delivers a remarkable +390.77 units profit and a 12.40% ROI, making it the strongest option for speculative bets. Rank 3 in sprints also presents a lucrative opportunity, offering an 8.60% ROI and +279.32 units profit, supported by an A/E of 1.04. However, caution is advised in middle distances, where most ranks underperform, and with Ranks 3 and 5 across larger fields and lower-class races. To maximize success, apply the FMFR Method before placing any bets, ensuring each selection aligns with your strategy and bankroll goals. Remember to create your free Race Advisor account to access these insights and refine your betting strategy with the most reliable tools available.
Read more horse racing rating stats articles…


Get access to the PR and VDW ratings and find top-rated winners every day.

Find out which horse has been tipped by the most newspaper tipsters each day.
Stop doing all the hard work yourself and get access to daily tips.

Find out which horse is predicted to be the fastest horse.
Track horses, trainers and jockeys, get instant alerts when they're running and see how profitable you are using them.
Stop working out the results of your bets by hand. Simply add your bets each day and let us automatically show you the results.
Thursday Horse Racing Tipster Proofing
Stratford - 12:25
Excellent article, Michael. Very informative and much appreciated. Thank you.
Thank you 🙂
A high quality article as expected and one which provides considerable valuable information for thought and action.
Invaluable information as always Michael! You’re taking our betting knowledge to a much higher level, for which much thanks!
Best,
Philippa
I have 4 systems using the RA Stats and I will be using the information
in this high grade article to put them to the test.
I look forward to articles in the coming weeks.
Thanks for all your hard work
There are many producers of ratings but few take the time to explain how best to use them other than the top rated win x% of the time. I have always thought that ratings should come with an in-depth analysis and guidance to make them profitable, and this is a great start. Thank you.
My pleasure, I’m looking forward to letting you know when the next section is out!
Hi Michael. A very informative read, thank you. However, what isn’t clear to me is, when I am analysing a race, how do I calculate a/e and ROI for each horse? I have purchased and downloaded the ratings this morning and I cannot see these fields on the CSV so I assume that I need to generate this data for myself.
I’m pleased you enjoyed it. It’s very difficult to calculate the A/E and expected ROI for each horse before a race, these are more numbers we can use on historic data to help us interpret how to use the ratings on future racing. For example, if we were looking at PR Rank 2 on the flat, we know that it has made a good ROI, but the A/E is less than 1. This tells us that there isn’t an expected advantage, although it made a good ROI in the last year we can expect (at some point) a levelling of this back downwards. It is possible to have a positive ROI where the A/E is less than one, but this is usually a low ROI, profit is made from high volume, and there are very big bankroll swings.
Back to PR Rank 2… the A/E is only 0.99, which means we can expect this to be pretty close to break even (or profitable if lots of volume and low ROI as mentioned above). However, it isn’t going to take much to push that A/E above 1.00 and gain an expected advantage as well as the positive ROI. Now we need to ask ourselves… how?
There are a number of ways, we can filter more as we find out more statistics in this article, but initially I would simply suggest using the FMFR method on them. This alone should be able to bring it to a positive expectation (with a bit of practice, and assuming you are tracking your results). However that may be too high a volume of horses to consider each day (although you only ever need to consider as many as you have time for). With that in mind, we could look for horses that are in the 3rd to fifth position of the betting market and have a PR Rank 2, and then use the FMFR Method on them. I haven’t specifically analysed this statistically, however we know horses with a PR Rank 2 win 20% of the time on average. We can expect that to drop if we remove the betting market favourite and second favourite, but the odds will increase as the market is possibly underestimating their chance. We can then increase the winning rate back up using the FMFR Method because this process will enable us to remove the horses which are clearly not likely to perform strongly in the race.
This is just an example of one way that we can use the information in this article.
As a stats geek myself I appreciate how much time and effort goes into a post like this. Thanks for shouldering most of the burden.
Well it is all gobbley gook to me,
In summery how do you use the ratings
Thank you for the message, we are looking at building this article out and putting a summary and “what to do next” with it.
I suspect the A/E figures for classes 1 through 5 are incorrect. They’re all considerably greater than 1 suggesting there’s an advantage for every one of the first five ranked in all classes. If this were the case, all five ranks could be backed proportionately in every race for a huge profit. It’s clearly not the case.
Well spotted Andrew, we will check these figures, thank you.
Will you be annualizing 2023 and 2024 also Michael as it would be interesting to see if any of the trends repeat themselves.
Good question and idea. We don’t have plans to do this currently, but I’ve made note to look into how we could do this as a regular piece.