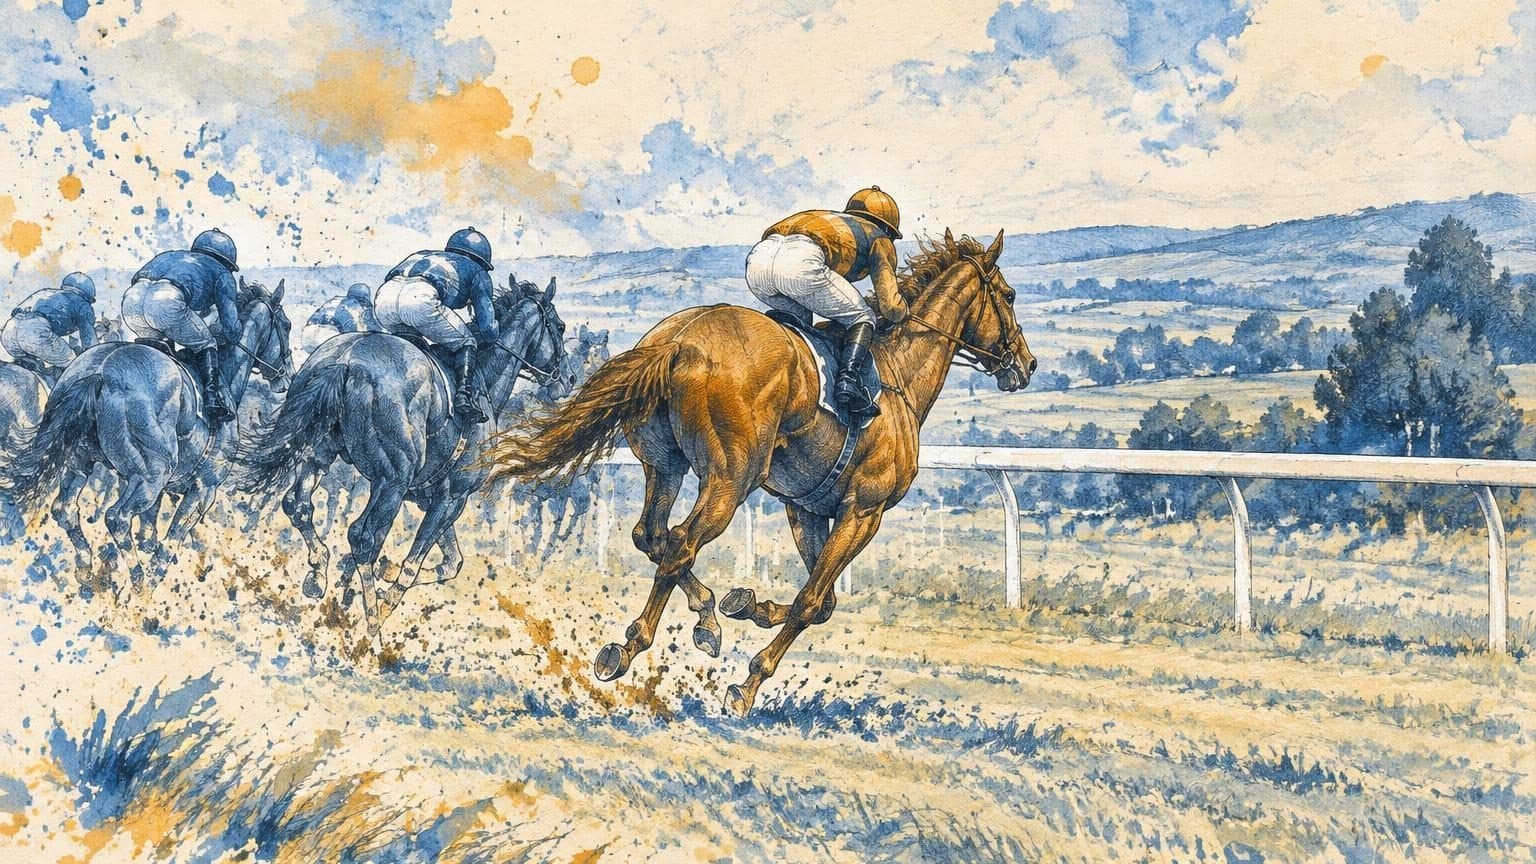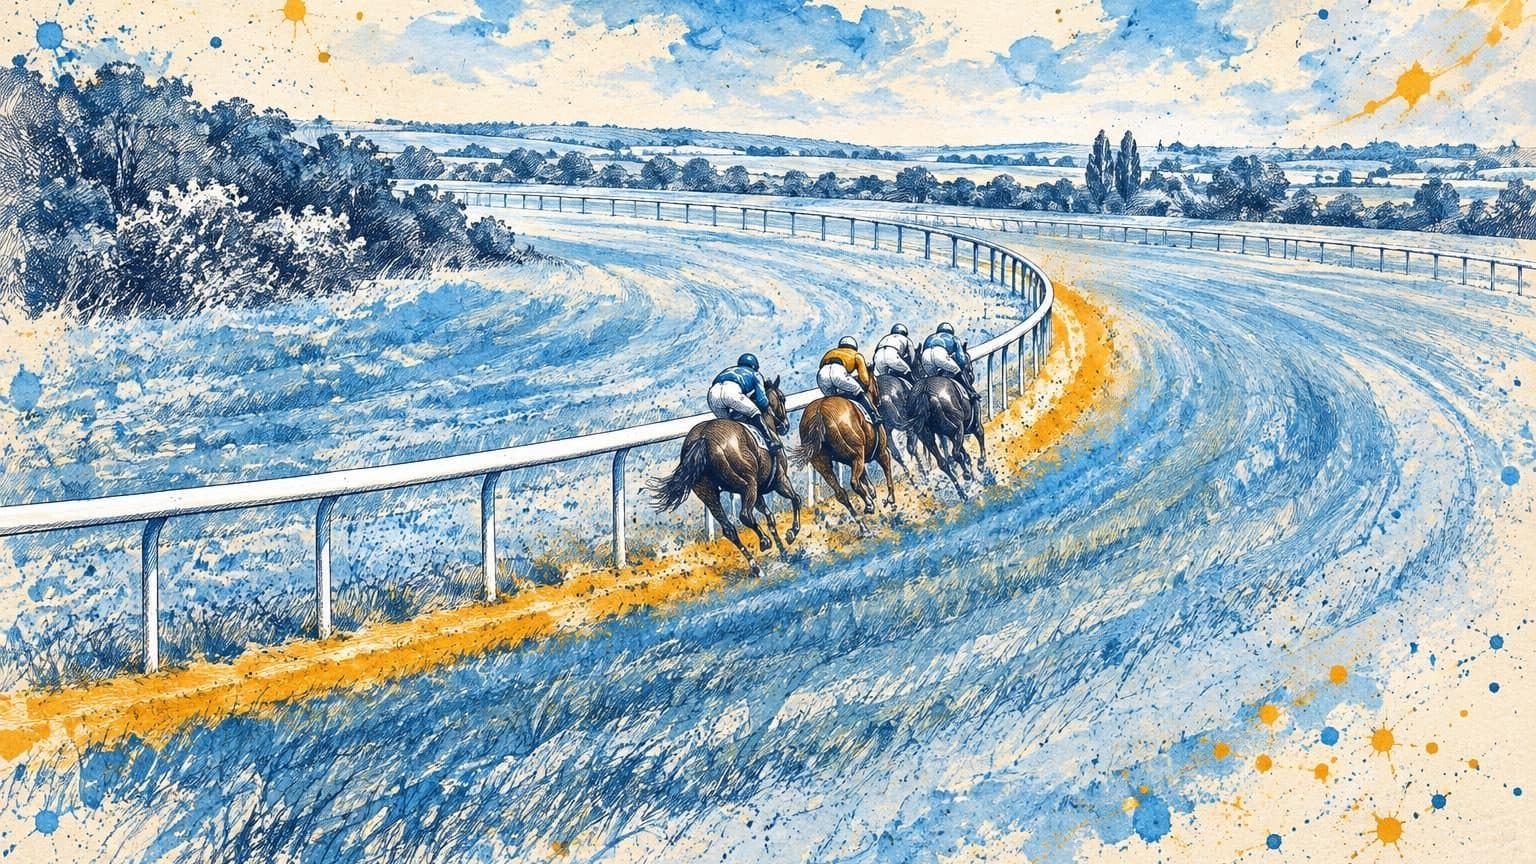
A front-runner wins at Worcester. A horse that runs in the same style fades to fifth at Doncaster a week later. Two races, two very different shapes once the tape went up. Most bettors file it under “that’s racing”. A more useful question is whether the track was doing part of the work.
Track pace bias hides in plain sight. It does not show up in the form figures or the Racing Post comment, and the layout of a course is a plausible reason for it. The long-run figures show it at certain UK tracks, where front-runners have performed well enough to nudge an A/E ratio (actual winners divided by the winners the odds implied) off centre. At others it barely registers. Knowing which is which is where the work pays off.
What is track pace bias in horse racing? It is the tendency of a course to favour front-runners or closers, based on its layout, length, turns and finishing straight. In an earlier Race Advisor analysis of more than 1.5 million UK and Irish runners from July 2013 to March 2026, the effect was real but uneven: at some courses, horses expected to lead win more than the market expects, and at others the reverse is true. The overall figure averages out, but the course-by-course picture does not.
What does track pace bias actually mean?
Imagine two racecourses. The first is a tight six-furlong oval with sharp turns and a short run-in. The second is a galloping mile-and-a-half loop with a long, stiff uphill finish. Send the same field round each in turn and the race that develops will not be the same.
On the tight track, a horse that breaks well and gets to the front cheaply is hard to peg back. The turns reward early position, and the straight is too short for a closer to wind up. On the galloping track, the front-runner has to work for longer, and a closer has time and ground to mount a challenge. The hill at the end rewards a horse with something left.
That is track pace bias: the course rewards a running style. The reward is small but repeatable, and over a large sample it shows in the win rate of horses that match it. Markets are good at pricing most things, and pace is one of them, but not perfectly, and not everywhere.
What does 13 years of UK racing say about pace?
Across the whole dataset (over 1.5 million runners, July 2013 to March 2026, priced at Betfair SP, the exchange’s closing price), the overall picture is a tidy one:
- Horses with a Predicted Race Pace of Fast won 10.7% of 380,998 runs, an A/E of 1.00.
- Lone Fast runners (the only front-runner in their race) won 12.1% of 15,626 runs, an A/E of 0.98.
- Predicted Slow-pace races delivered winners 9.7% of the time, an A/E of 1.01.
The market prices predicted pace sensibly on average, which means there is no blanket “back every front-runner” angle, and that is a good thing to know. It points you to the better question: not whether pace matters, but where it matters more than the price suggests. The answer is a list of specific UK tracks.
Which courses reward horses that lead?
Filter the same runners by course and look at front-pace horses (Fast plus Lone Fast combined). Most UK tracks sit between 0.99 and 1.01. A few stand out.
- Worcester: 4,812 front-pace runners, 12.9% winners, A/E 1.07.
- Ripon: 3,635 runners, 11.7% winners, A/E 1.05.
- Cartmel: 2,856 runners, A/E 1.04.
- A cluster at 1.03: Chepstow (7,017 runners), Catterick (7,468), Chester (3,996), Stratford (4,077), Huntingdon (3,670) and Wincanton (3,477).
- Around 1.02: Sandown, Newmarket, Pontefract, Market Rasen and Carlisle.
What links many of them is shape. Sharp, well-banked tracks reward horses that can lay up. The numbers do not prove the course is the only cause, but they do show that horses likely to lead at these tracks have matched or beaten their prices over the long run.
Which courses give closers time?
The other end of the table is just as useful, because it tells you where to be more selective about a front-runner.
- Uttoxeter: 6,520 front-pace runners, 10.7% winners, A/E 0.94.
- Ascot: 6,124 runners, 8.0% winners, A/E 0.95.
- Cheltenham: 5,751 runners, 7.5% winners, A/E 0.95.
- Doncaster: 8,310 runners, 9.3% winners, A/E 0.95.
- Nottingham, Newbury, Bath and Epsom sit between 0.95 and 0.96, and Wolverhampton, on nearly 25,000 runners, at 0.98.
These are mostly galloping tracks, with stiff finishes, long straights and wide bends, where a horse with petrol left has the advantage over one that spent it early. The gap is small, so it is not a rule to apply blindly, but it shifts your thinking. A horse that looks a confident pace pick at Worcester deserves a closer look at Ascot, and the rest of its profile needs to do more of the work.
You can see each runner’s projected pace and course profile on today’s race cards, which include the Speed and Pace tab alongside the predicted race shape.
How do you use pace bias without overreacting?
Use it as a tiebreaker rather than a primary driver. The widest course-level spread in this analysis runs from an A/E of 0.94 (Uttoxeter) to 1.07 (Worcester). That is modest next to the edges that really move a selection, so it works best as a final nudge.
- Start with the horse. Build your selection from its own profile first: how PR ratings price the field, form in similar conditions, class movement and speed ratings in context.
- Open the pace map. Identify which horses want to lead. If there is only one front-runner in the field, the bias matters more, because it is likely to get its own way.
- Check the course. At a front-pace-friendly track such as Worcester, Ripon, Chester, Chepstow, Catterick, Cartmel, Stratford, Huntingdon or Wincanton, the likely leader gets a small nudge in its favour.
- Be selective at galloping tracks. At Ascot, Cheltenham, Doncaster, Newbury, Uttoxeter, Bath, Nottingham or Epsom, look for a front-pace horse whose wider profile is strong enough to carry it without help from the track.
- Keep going in perspective. Across the major going codes, the front-pace A/E sits between 0.99 and 1.02, so the track effect is larger than the surface effect.
Spotting front-runners is mostly habit. Run your eye down the last three to six starts and look for horses that sit in the leading group through the first furlong. Race Advisor’s Speed and Pace tab condenses that work into a Total Pace Score (a single number for how far forward a horse tends to run) and a Predicted Race Pace label (Fast, Lone Fast, True or Slow) for every runner. Our guides to how pace affects horse racing and horse racing pace ratings go further.
Sample size matters too. A reading across 6,520 runners is firmer than one across 1,000, so lean on the big-sample courses such as Catterick, Chepstow, Doncaster and Wolverhampton.
What is the takeaway?
Track pace bias is a small advantage that costs nothing extra to read, and it adds up quietly across a season. You already know the course and who wants to lead. The one question to add is whether this track is helping the pace or asking for a closer.
Ask it as one check alongside the horse’s wider profile. Where the course helps a likely leader, you have a little extra reason for it. Where there is no convincing pace case, that is a race you can simply leave alone. To try it, open today’s race cards and look at the Predicted Race Pace label for every runner in your first race.