Van Der Wheil Rating: Does It Really Work?
There are two ratings available on the Race Advisor website, the VDW (Van Der Wheil) rating and the PR (Power Rating) rating.
You can access them by registering or logging in to your account.
To access these ratings for every race is just £2 per day, and you can access them on a day-by-day basis, with no subscription. You can also use our Premium Access membership (£47 per month) for unlimited access to all our premium tools.
In this article we are going to investigate the VDW rating to uncover how it performs under different race conditions.
The purpose is to enable you to find ways that you can use it to suit your own horse racing analysis and betting.
Contents
Why Ratings Alone Won’t Make You Rich (But They Can Be the Trigger)
Let’s get one thing straight—no rating, no matter how sophisticated, is going to make you rich on its own.
But used the right way, a rating like VDW can be the trigger that tilts the odds in your favour.
It’s not about using one number blindly. It’s about seeing what that number really means, and how it fits into the bigger picture of a profitable betting strategy.
And in the case of VDW, that bigger picture starts with something most people never think to ask:
“Why does this horse deserve to be near the top of the VDW rating?”
Let’s dig into what that really means—and how to use it properly.
What Is The VDW Rating?
This rating is based on a system popularised by the legendary Van Der Wheil, and it’s built on a simple but deadly effective idea:
Consistency, class, and recent performance matter more than hype.
The VDW rating looks at a horse’s recent form, placing emphasis on:
- How often it finishes in the top three
- How well it runs under similar race conditions
- And whether it’s genuinely competitive at today’s level
It’s not swayed by public money, trainer PR, or a flashy speed figure from 6 months ago.
Instead, it’s designed to spotlight horses that consistently show up, even when others are flaky.
If you’re someone who’s sick of watching “talking horses” get smashed in the market only to flop when it counts, the VDW rating is your antidote.
What Does A “Top VDW” Horse Mean?
Unlike the PR rating (which zeroes in on raw performance potential), VDW is a filter for consistency and reliability.
If a horse is top-rated on VDW, it usually means:
- It has been regularly hitting the frame (1st, 2nd, or 3rd)
- It’s not being thrown into an unrealistic class
- It’s maintained form across at least its last 3 runs
Here’s the part most people miss:
A top VDW horse isn’t necessarily the fastest or the flashiest… but it’s often the one with the fewest questions to answer.
That makes it a brilliant rating to use in handicaps and larger fields, where consistency often trumps raw ability.
How we measure performance of VDW
To make sense of any rating, VDW included, we need to step away from gut instinct and look at the numbers.
That’s why we use a set of universal metrics across all our ratings. They give us a level playing field to assess where a rating shines… and where it might fall short.
Here’s how we break it down:
- No. Horses – Total number of runners with the rating over the tested period
- Win Rate – The percentage of those that actually went on to win
- Profit – Total profit (or loss) to £1 stakes
- ROI – Return on Investment—how much profit you’d make from every £1 bet
- A/E Ratio – The average/expected performance: anything over 1.00 suggests an edge worth backing; under 1.00 might suggest laying opportunities
- Sel. Mth – Average number of selections per month using the rating
- Est. Drawdown – The largest estimated losing streak over the period tested
When looking at VDW, we focus primarily on the rank position of each horse and where they sit relative to others in the same race.
A rank of 1 means the highest-rated VDW horse, 2 the second-highest, and so on.
In this breakdown, we’ll spotlight the top five VDW ranks, since horses ranked lower than this tend to see a steeper decline in win rate. That said, those lower ranks can still offer insight, especially if you’re into lay betting or looking for big-odds, low-hit-rate plays.
We’ll explore VDW rankings for now, and in future updates, we’ll dig deeper into rating scores, context filters, and how they interact with real-world race conditions.
The VDW Horse Racing Rating Baseline
Let’s begin our investigation by finding our baseline, a starting point for us to compare everything else with. This starting point contains horses in every single race for three years of racing from 2022 to 2024. There are 199,267 horses racing in this sample.
Let’s get stuck into the numbers.
Below is the performance data for horses ranked 1st to 5th using the VDW rating. This gives us a baseline to understand how each rank performs across thousands of races, and more importantly, where the value might actually be hiding.
| VDW Rank | No. of Horses | Win Rate % | Profit | ROI % | Average Odds | A/E | Sel. Mnth | Est. Drawdown |
| 1 | 44565 | 25.76 | 16.65 | 0.04 | 5.54 | 1 | 1238 | 36 |
| 2 | 40826 | 17.61 | -161.66 | -0.4 | 9.21 | 1 | 1134 | 55 |
| 3 | 39749 | 13.73 | -961.59 | -2.42 | 13.29 | 1 | 1104 | 72 |
| 4 | 38093 | 10.85 | -1865.65 | -4.9 | 17.32 | 1 | 1058 | 92 |
| 5 | 36034 | 8.73 | -574.81 | -1.6 | 21.84 | 1 | 1001 | 115 |
This is raw data. No filters, no adjustments, no clever angles. And that makes it incredibly useful.
What We See Here
The top-rated horse on VDW has a strike rate of over 25 percent. That is a very solid number. In fact, it is one of the only raw ratings that returns a breakeven profit without any extra filters. That tells us something. Rank 1 is rock solid.
From there, the performance declines steadily. Rank 2 is still winning nearly one in five, but the returns drop into the red. And by Rank 5, although you are getting the occasional big price winner, the overall picture is clear. There is a lot of variance and long losing runs are a certainty.
There is something else worth noticing. The A E ratio is exactly 1.00 across the board. That means the VDW rating is very well priced by the market. It is not being overbet. It is not being ignored. It is sitting exactly where it should be. That makes it a fair rating. A neutral edge. And that is a good thing, because it means you have room to build strategy around it without worrying the market is eating your profits.
Of course, with drawdowns stretching past 100 points on the lower-ranked runners, this is not something you would follow blindly. And you are not meant to. This is not a system. It is a lens. A filter. A way of narrowing the field down to the few that deserve a closer look.
Across these five ranks, there are over eleven thousand winners in the sample. So while only Rank 1 holds its ground from a pure profit point of view, this rating clearly knows how to point us toward the right end of the field.
We now have our VDW baseline. From here, we will start digging into when it performs best, how to identify its strongest setups, and how to use that to give ourselves an edge the crowd will never see coming.
The VDW Horse Racing Rating by Race Types
We are now going to break down how the top five VDW rated horses perform across different race types. This will show us where the rating holds up best and where you might want to think twice before backing to win.
These results are based on win bets only. That means straight-up, one-point win stakes. No filters. No staking plans. Just raw performance.
In places where the win performance looks weak, that does not mean the rating is useless. It might suggest there is value in the place market. Or that laying those horses could be more profitable. The key is to look for patterns. Because when you spot them, you start to uncover how to apply the rating with real purpose.
Flat All Weather (A.W.) Horse Racing
| VDW Rank | No. of Horses | Win Rate % | Profit | ROI % | Average Odds | A/E | Sel. Mnth | Est. Drawdown |
| 1 | 10512 | 25.27 | 320.68 | 3.05 | 7.17 | 1.0 | 292 | 32 |
| 2 | 9539 | 17.24 | -273.96 | -2.87 | 14.19 | 1.0 | 265 | 48 |
| 3 | 9424 | 13.49 | -249.08 | -2.64 | 22.54 | 1.0 | 262 | 63 |
| 4 | 9020 | 10.98 | -119.29 | -1.32 | 30.45 | 1.0 | 251 | 78 |
| 5 | 8715 | 9.19 | 284.45 | 3.26 | 39.95 | 1.0 | 242 | 94 |
There are 47,210 runners in Flat All Weather races across the top five VDW ranks, with over 11,000 winners coming from this group. That is a strike rate of 23.4 percent overall and shows the rating performs strongly on this surface. The top-rated horses not only win often, they also return a small profit, while Rank 5 surprisingly shows a positive ROI thanks to a few very big priced winners.
Flat Turf Horse Racing
| VDW Rank | No. of Horses | Win Rate % | Profit | ROI % | Average Odds | A/E | Sel. Mnth | Est. Drawdown |
| 1 | 16362 | 24.29 | 101.17 | 0.62 | 7.59 | 1.0 | 455 | 35 |
| 2 | 14949 | 17.31 | -537.13 | -3.59 | 13.38 | 1.0 | 415 | 51 |
| 3 | 14462 | 13.82 | 87.18 | 0.60 | 20.77 | 1.0 | 402 | 64 |
| 4 | 14091 | 11.13 | 19.14 | 0.14 | 27.48 | 1.0 | 391 | 81 |
| 5 | 13451 | 8.93 | -548.47 | -4.08 | 35.54 | 1.0 | 374 | 102 |
There are 73,215 runners in Flat Turf races across the top five VDW ranks, and they account for a strong number of winners led by Rank 1 with over 24 percent success and a profit to back it up. Ranks 3 and 4 also show surprising signs of life with positive returns, although the drawdowns increase and strike rates fall quickly after the top rank.
Chase Turf Horse Racing
| VDW Rank | No. of Horses | Win Rate % | Profit | ROI % | Average Odds | A/E | Sel. Mnth | Est. Drawdown |
| 1 | 6208 | 27.92 | -164.78 | -2.65 | 5.66 | 1.0 | 172 | 27 |
| 2 | 5692 | 19.27 | -291.08 | -5.11 | 9.63 | 1.0 | 158 | 40 |
| 3 | 5509 | 15.30 | 158.66 | 2.88 | 15.77 | 1.0 | 153 | 52 |
| 4 | 4958 | 11.17 | -663.54 | -13.38 | 23.03 | 1.0 | 138 | 72 |
| 5 | 4452 | 9.23 | 198.01 | 4.45 | 29.95 | 1.0 | 124 | 87 |
There are 26,819 runners in Chase Turf races across the top five VDW ranks, and the strike rate is strongest of all race types so far, with Rank 1 hitting at nearly 28 percent. Although Rank 1 does not show a profit, Ranks 3 and 5 deliver strong returns, suggesting this is a race type where longshots still offer real value if you know where to look.
Hurdle Turf Horse Racing
| VDW Rank | No. of Horses | Win Rate % | Profit | ROI % | Average Odds | A/E | Sel. Mnth | Est. Drawdown |
| 1 | 10083 | 26.70 | -232.79 | -2.31 | 9.92 | 1.0 | 280 | 30 |
| 2 | 9257 | 17.33 | 1004.19 | 10.85 | 24.85 | 1.0 | 257 | 48 |
| 3 | 9024 | 12.99 | -991.68 | -10.99 | 42.68 | 1.0 | 251 | 65 |
| 4 | 8725 | 10.17 | -942.90 | -10.81 | 63.42 | 1.0 | 242 | 85 |
| 5 | 8212 | 7.93 | -361.32 | -4.40 | 85.01 | 1.0 | 228 | 109 |
There is something odd happening in Hurdle Turf racing.
The top-rated VDW horses are winning plenty, nearly 27 percent of the time, in fact. But here’s the twist. They are not the ones making the money.
That honour goes to the second-best rated horses. They are not only delivering double-digit ROI, they are doing it at big prices too. This is the kind of anomaly that grabs attention. If you were going to dig deeper into just one part of this dataset, this is the one.
There is gold in the second row. You just need to know how to mine it.
What Do These Results Really Tell Us?
Numbers are powerful, but staring at a table of percentages is not the same as seeing what those numbers mean in the real world.
So before we start talking strategy, we are going to look at things visually.
Let’s start with the most important stat of all, which race types deliver the most winners using the VDW rating.
This will show us, at a glance, where the rating is doing the heavy lifting… and where it might just be filling space on the racecard.
Race Type Analysis Winning Rate
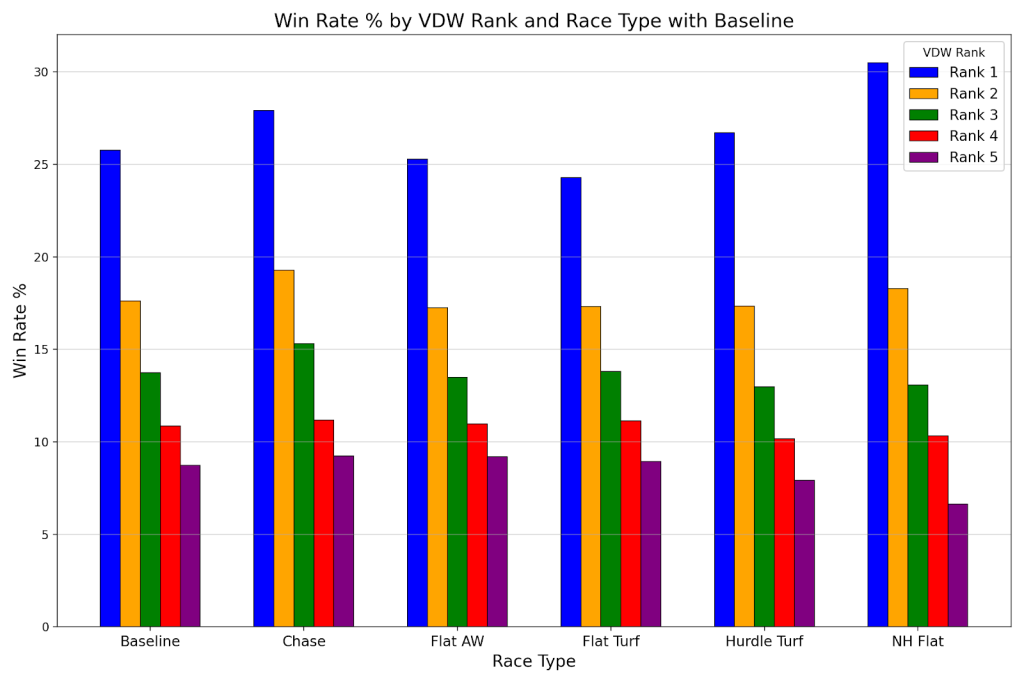
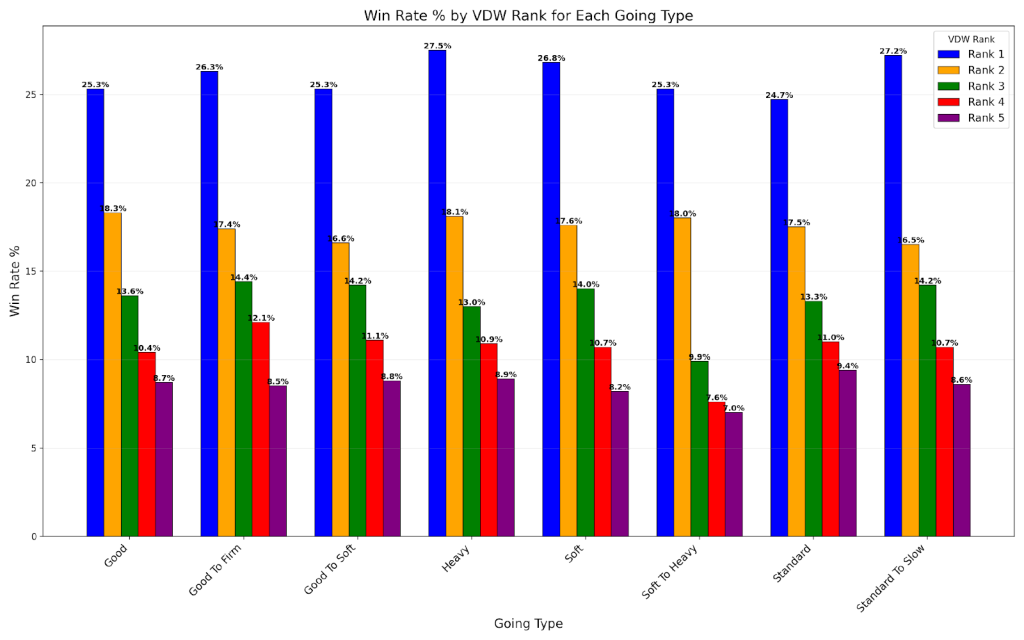
This chart confirms what the baseline hinted at. The top-ranked VDW horse is not just consistent, it dominates. Across every race type, Rank 1 leads with a win rate between 24 and 31 percent, peaking in National Hunt Flat races.
That kind of predictability is gold. It means you can use VDW Rank 1 as a foundation in almost any race type and know you are working with a solid percentage play. From there, the win rate falls in clean, logical steps through each rank, which shows the rating structure is holding strong.
If you are building systems based on strike rate, VDW gives you a clear ladder. Start at the top, apply filters, and let the rest fall into place.
Race Type Analysis Profit
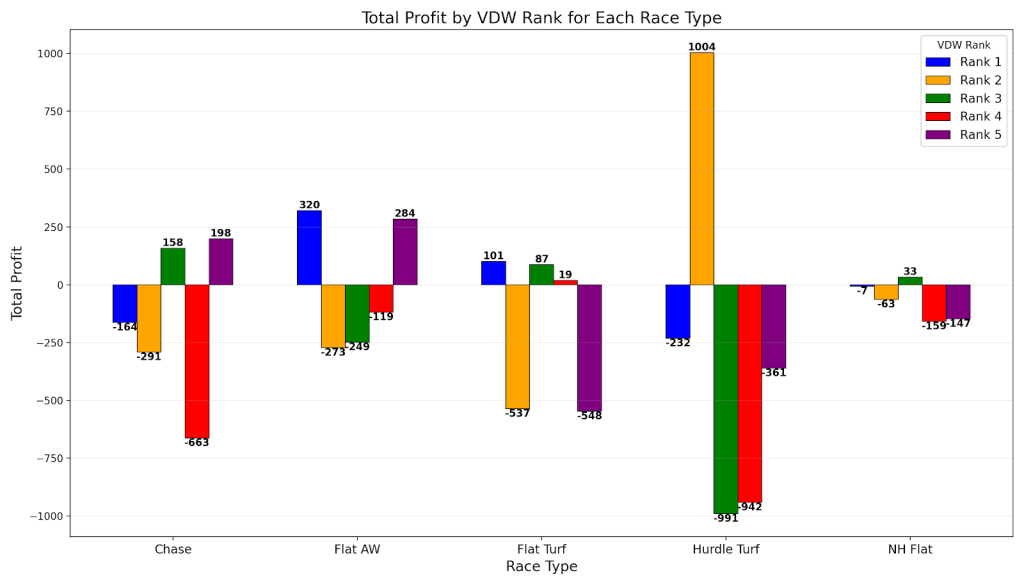
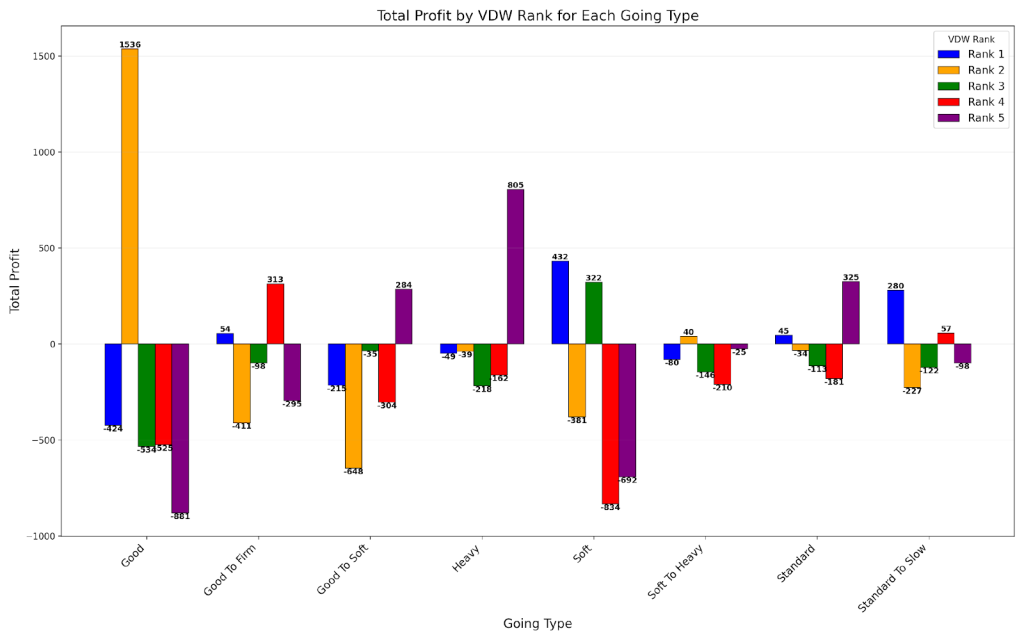
There are two major standouts in this profit chart. The first is Hurdle Turf Rank 2, which delivers a runaway profit that dwarfs everything else. That is not a small edge. That is a strategy in waiting. The second is Flat All Weather Rank 1, which shows consistent gains with a strong strike rate behind it.
Chase races tell a different story. The lower-ranked horses are doing the damage, while Rank 1 works hard but finishes in the red. That flip in profit curve should not happen, but it does, and it is worth testing further if you like betting against the crowd.
Every other category holds a clear message. The top-ranked horses often do well, but the profit is scattered. That means VDW is not just a winner finder, it is a pressure gauge. You have to know where to lean in, and where to let it breathe. Now we do.
Race Type Analysis ROI
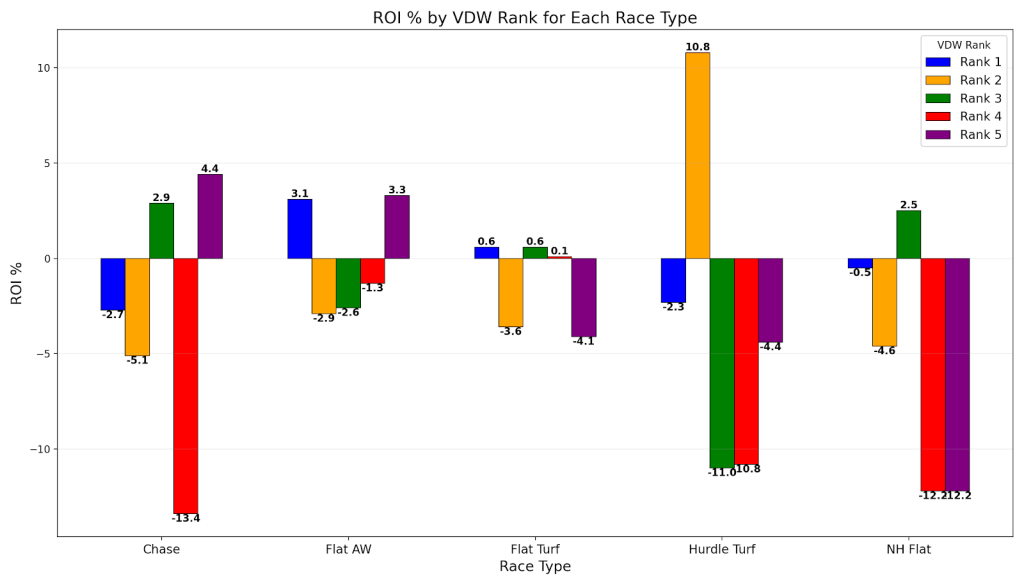
Return on investment is where things start to separate smart filters from raw rank chasing.
The most striking result is again in Hurdle Turf Rank 2, delivering a huge 10.8 percent ROI. That is the kind of edge professional bettors spend years trying to find. You do not ignore that.
Flat AW and Chase also throw up interesting angles. The top-ranked horses return a small profit, but the real gains come from deeper ranks, especially Rank 5 in both cases. This tells us there is hidden value where the crowd is not looking.
The big takeaway here is that VDW does not just help you find the favourite. It helps you find when the favourite is overpriced, and when a longer shot is still the smarter bet.
Race Type Analysis A/E
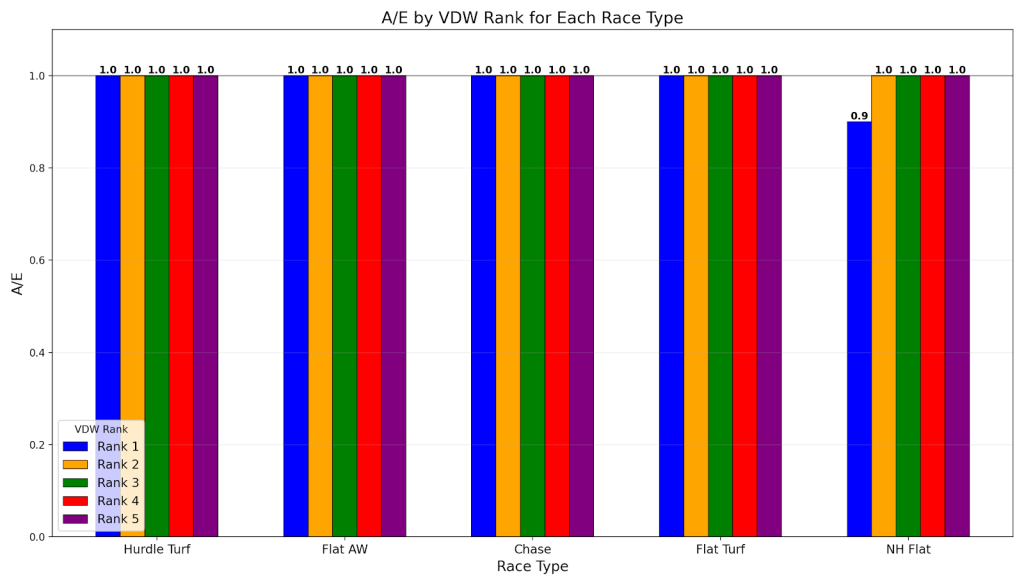
There is not much drama here, and that is exactly what makes it so interesting.
Across every race type and every VDW rank, the A E ratio holds steady at 1.00. That means the rating is being priced fairly by the market. No hype, no inflation, no edge being eaten up by public money.
The only exception is National Hunt Flat Rank 1, which dips slightly below at 0.9. It is a small shift, but worth noting if you are looking to tighten your filters or avoid races where favourites might be overbet.
What this tells us is simple. The VDW rating is respected by the market, not exploited. That makes it a powerful base for building strategies with genuine long-term potential.
So What Do We Do With This?
Let’s be clear. This is not your cue to go and back every top-ranked VDW horse in sight.
But what you have now is a strong starting point. These ranks, especially in certain race types, are doing serious work. If you want to apply something like the FMFR method, this is where you begin.
That said, I do not recommend you stop here. Because this is just the surface.
What we have seen so far are raw signals. And when you start layering in price, pace, trainer form, class shifts, and other race conditions, those signals sharpen. That is when strategies start to take shape.
Now that we have a foundation, I want to show you how to use this data properly. The next step is where most people get it wrong. But it is also where you can get it right… fast.
In the next section, we will break down exactly how to turn this insight into a structured approach you can rely on.
How you should use data to win
Most people look at profit first when deciding if a method is worth using.
That is the fastest way to get fooled.
You saw it earlier with VDW Rank 2 in some race types. Big profit, impressive totals, and then you check the A/E or ROI and suddenly it is not so clear anymore. High volume plus variance can make anything look like it works, until it doesn’t.
The two numbers that matter most are A/E and ROI. In that order.
If they are pointing in the right direction, then you are on solid ground. From there, look at the number of selections. Too many and it is not manageable. Too few and you are not getting enough action. Find the middle. Then check the drawdown. Because that tells you what your bankroll will really go through, and whether you are actually built to handle it.
For backing, whether you are going for win or place markets, you want the A E to be above 1.05. That gives you room to breathe. For laying, you want it under 0.95. The further from 1.00, the stronger the advantage. But if the number looks huge, check the sample size. One or two big-priced flukes can skew the whole thing.
Once the A/E checks out, move to ROI. People obsess over sky-high numbers, but the truth is anything over 5 percent is excellent long-term. Even something like minus 3 percent can be made profitable using the FMFR method, which is why I always recommend applying it before placing any bets. If you do not already have access to FMFR, create your free account and grab it from the dashboard.
Next, ask yourself… can I handle this volume? Too many horses? Start filtering. Too few? Zoom out. Add flexibility. FMFR helps here too because you will not be betting on every qualifying horse. You are filtering them in real time with an edge.
Finally, deal with the drawdowns. That is your stress test. Your bankroll should be at least three times larger than the biggest drawdown in your data. If that number is too big for you, then pause and pivot. Start again with a more comfortable angle.
And do not just look at the drawdown. Estimate how long it might last. A one hundred and fifty unit downswing with one hundred bets a month could take six to twelve weeks to crawl out of. That is assuming you stay calm. Most people panic and ditch the strategy before the edge kicks back in.
If the thought of that happening makes your stomach turn, then adjust. Focus on win rate. Go smaller. Be selective. This is not about ego. It is about building an approach you can stick with when things get tough.
That is how you build something that lasts.
Now let’s bring that mindset back to the VDW rating and see how to turn all this into something you can actually use.
The VDW Horse Racing Rating by Going
Now we are going to break down the performance of the top five VDW rated horses across different types of ground.
The going describes the condition of the racecourse surface, and it can make a huge difference to how a horse runs. From firm ground that rides fast to heavy ground that turns into a slog, some horses handle it well and others fold.
These results are based on straight win bets only. But as always, keep in mind that when the win rates or profits drop, it might just be pointing you toward a better opportunity in the place or lay markets.
This is where things start to get even more interesting. Let’s see how the VDW rating handles a change in underfoot conditions.
Horse Racing on Firm going
| VDW Rank | No. of Horses | Win Rate % | Profit | ROI % | Average Odds | A/E | Sel. Mnth | Est. Drawdown |
| 1 | 99 | 21.21 | -27.83 | -28.11 | 7.40 | 0.8 | 3 | 19 |
| 2 | 86 | 23.26 | 4.81 | 5.59 | 10.32 | 1.2 | 2 | 17 |
| 3 | 77 | 12.99 | -14.20 | -18.44 | 9.84 | 0.8 | 2 | 31 |
| 4 | 63 | 12.70 | -18.37 | -29.16 | 27.93 | 1.0 | 2 | 31 |
| 5 | 63 | 11.11 | 2.63 | 4.17 | 28.82 | 1.1 | 2 | 35 |
There are not many races run on firm ground, so the sample size here is small. That means we need to be cautious with conclusions. That said, a few things do stand out.
Rank 2 is the strongest performer, with a win rate above 23 percent, a positive ROI, and a solid A/E of 1.2. This is one of the few spots on firm going that shows a real back-to-win advantage. Rank 5 also shows a profit, but the volume is too small to trust without deeper testing.
The big surprise is Rank 1, which usually leads the way but underperforms here with both ROI and A/E in the red. This could be a signal that on firmer ground, reliability drops and pricing becomes less accurate. It might be a race condition better suited to place or lay strategies.
Horse Racing on Good to Firm going
| VDW Rank | No. of Horses | Win Rate % | Profit | ROI % | Average Odds | A/E | Sel. Mnth | Est. Drawdown |
| 1 | 4414 | 26.30 | 54.04 | 1.22 | 6.78 | 1.0 | 123 | 28 |
| 2 | 3949 | 17.45 | -411.16 | -10.41 | 12.72 | 0.9 | 110 | 43 |
| 3 | 3968 | 14.42 | -98.82 | -2.49 | 18.80 | 1.0 | 110 | 53 |
| 4 | 3664 | 12.09 | 313.93 | 8.57 | 24.90 | 1.1 | 102 | 64 |
| 5 | 3462 | 8.55 | -295.16 | -8.53 | 30.19 | 0.9 | 96 | 91 |
On good to firm ground, VDW Rank 1 lives up to expectations. It shows a strong win rate of over 26 percent, a healthy ROI, and an A/E of 1.0. This is a zone of stable performance and consistent value.
But the real surprise is Rank 4, which delivers an unexpected profit of over 300 with an A/E of 1.1 and a strong ROI of 8.57 percent. This could be a pocket of underbet value worth exploring further. It may not win often, but it seems to be winning when it matters.
Rank 2, on the other hand, looks dangerous. Despite a fair win rate, the ROI is deeply negative and the A/E is below 1.0. That is usually a sign the horses are being overbet without delivering enough in return.
Horse Racing on Good going
| VDW Rank | No. of Horses | Win Rate % | Profit | ROI % | Average Odds | A/E | Sel. Mnth | Est. Drawdown |
| 1 | 13074 | 25.30 | -424.12 | -3.24 | 7.81 | 1.0 | 363 | 32 |
| 2 | 11970 | 18.25 | 1536.00 | 12.83 | 16.62 | 1.0 | 333 | 47 |
| 3 | 11607 | 13.60 | -534.65 | -4.61 | 28.23 | 1.0 | 322 | 64 |
| 4 | 11117 | 10.44 | -525.25 | -4.72 | 37.22 | 1.0 | 309 | 84 |
| 5 | 10440 | 8.72 | -881.53 | -8.44 | 49.54 | 1.0 | 290 | 101 |
There are over 58,000 runners across the top five VDW ranks on good going, making this one of the most data-rich conditions in the entire analysis. Rank 1 posts a strong win rate of 25.30 percent but ends up with a negative ROI. The A/E sits at 1.0, meaning these horses are performing as expected, but they are not offering an edge when backed blindly.
The real standout is Rank 2, which delivers over 2,000 winners and a total profit of 1536.00 to level stakes. The ROI sits at 12.83 percent, which is impressive, but the A/E is exactly 1.0, meaning the market has priced these horses correctly. This profit may be real, but without a higher A/E, we cannot say with confidence that there is an edge. It could be variance, and it needs further investigation before being relied on.
Lower ranks do not hold up nearly as well. ROI drops sharply and drawdowns increase, especially at Rank 5. That tells us most of the value is concentrated at the top of the ratings here, particularly in Rank 2.
Horse Racing on Good to Soft going
| VDW Rank | No. of Horses | Win Rate % | Profit | ROI % | Average Odds | A/E | Sel. Mnth | Est. Drawdown |
| 1 | 6450 | 25.33 | -215.03 | -3.33 | 7.48 | 1.0 | 179 | 30 |
| 2 | 6062 | 16.63 | -648.28 | -10.69 | 15.48 | 0.9 | 168 | 48 |
| 3 | 5701 | 14.19 | -35.31 | -0.62 | 23.15 | 1.0 | 158 | 57 |
| 4 | 5651 | 11.06 | -304.03 | -5.38 | 36.92 | 1.0 | 157 | 74 |
| 5 | 5338 | 8.77 | 284.52 | 5.33 | 51.68 | 1.0 | 148 | 94 |
On good to soft ground, the VDW rating maintains a solid shape. Rank 1 continues to do the heavy lifting with a strong 25 percent win rate and a flat A/E of 1.0. It is consistent and predictable, though not profitable on its own.
Rank 5, surprisingly, turns a profit despite having the lowest win rate. This is almost entirely driven by very high odds. The A/E sits at 1.0, which tells us the market is pricing these runners accurately. So while the profit is real, it may be fragile and based on a few big outliers.
The rest of the ranks stay within expected limits. There is no clear edge showing up in the middle ranks, but there is nothing broken either. This is a going type where VDW seems to hold up evenly—useful for shortlisting, especially at Rank 1.
Horse Racing on Soft going
| VDW Rank | No. of Horses | Win Rate % | Profit | ROI % | Average Odds | A/E | Sel. Mnth | Est. Drawdown |
| 1 | 7056 | 26.84 | 432.93 | 6.14 | 8.47 | 1.0 | 196 | 28 |
| 2 | 6485 | 17.64 | -381.58 | -5.88 | 16.11 | 1.0 | 180 | 45 |
| 3 | 6299 | 14.03 | 322.87 | 5.13 | 27.89 | 1.0 | 175 | 58 |
| 4 | 6032 | 10.71 | -834.56 | -13.84 | 43.82 | 1.0 | 168 | 77 |
| 5 | 5729 | 8.17 | -692.25 | -12.08 | 55.74 | 0.9 | 159 | 102 |
Soft ground throws up two standout opportunities. Rank 1 is incredibly strong, delivering nearly 27 percent winners and producing a profit of over 400 points with an ROI above 6 percent. It is backed by a consistent A/E of 1.0, showing the market has not overpriced it. This is as close to plug-and-play as VDW gets on any going.
The surprise is Rank 3, which also returns a significant profit and a healthy ROI over 5 percent. With average odds around 28 and a strong volume of winners, this rank appears to be flying under the radar.
Ranks 4 and 5 fall apart quickly. High average odds combined with sharp losses and long drawdowns make them risky. But for those focused on backing the most reliable performers, Rank 1 on soft ground is one of the most promising angles in the entire VDW dataset.
Horse Racing on Soft to Heavy going
| VDW Rank | No. of Horses | Win Rate % | Profit | ROI % | Average Odds | A/E | Sel. Mnth | Est. Drawdown |
| 1 | 442 | 24.66 | -105.27 | -23.82 | 7.94 | 0.9 | 18 | 22 |
| 2 | 462 | 16.88 | 26.73 | 5.79 | 34.09 | 1.1 | 18 | 33 |
| 3 | 456 | 10.09 | -188.52 | -41.34 | 45.36 | 0.9 | 18 | 58 |
| 4 | 381 | 5.77 | -173.03 | -45.41 | 71.64 | 0.7 | 15 | 100 |
| 5 | 154 | 11.69 | 90.28 | 58.62 | 78.59 | 1.5 | 6 | 41 |
Soft to heavy going shows a very different pattern compared to the softer conditions earlier. Rank 1 still delivers a strong win rate at just under 25 percent, but it returns a loss with an ROI of minus 23.82 percent and an A/E of 0.9. This suggests the market may be slightly overestimating the top rated horses in these testing conditions.
The interesting opportunity sits with Rank 2, which posts a profit of 26.73, an ROI of 5.79 percent and an A/E of 1.1. Although the sample size is relatively small, these are the kind of numbers that suggest there may be some edge to explore at this rank when the ground is deep.
Lower ranks show typical patterns of decline. High odds lead to occasional big winners, like Rank 5 returning 90.28 profit and a huge 58.62 percent ROI, but the extremely small sample size makes this result unreliable for consistent betting.
Horse Racing on Heavy going
| VDW Rank | No. of Horses | Win Rate % | Profit | ROI % | Average Odds | A/E | Sel. Mnth | Est. Drawdown |
| 1 | 2527 | 27.46 | -49.25 | -1.95 | 8.54 | 1.01 | 2527 | 24 |
| 2 | 2352 | 18.11 | -39.76 | -1.69 | 17.74 | 0.97 | 2352 | 39 |
| 3 | 2282 | 13.01 | -218.32 | -9.57 | 30.49 | 0.93 | 2282 | 55 |
| 4 | 2168 | 10.89 | -162.51 | -7.5 | 44.19 | 1.02 | 2168 | 67 |
| 5 | 1945 | 8.89 | 805.38 | 41.41 | 60.18 | 1.04 | 1945 | 81 |
Heavy going creates some of the most extreme figures in the entire VDW dataset. Rank 1 stays very strong with a win rate of 27.46 percent, which is one of the highest strike rates across any going type. However, despite this consistency, it returns a small loss with an ROI of minus 1.95 percent and an A/E of 1.01. This tells us the market is pricing these runners almost perfectly and no obvious advantage exists when backing them blind.
Rank 5 delivers the shock result. It shows a profit of 805.38 and a huge ROI of 41.41 percent, backed by an A/E of 1.04. These results are driven by very high average odds, sitting above 60, and a much smaller sample size. While the profit is real, this is exactly the type of figure where variance could be heavily influencing the outcome.
Ranks 2, 3 and 4 all sit in loss territory with negative ROI and A/E figures around or below 1.0. This keeps the focus firmly on Rank 1 for stability, but leaves some room for aggressive longshot players who are willing to test the extreme ranks cautiously.
What do these results mean?
Let’s look at the results of our going analysis visually…
Going Analysis Winning Rate
The VDW rating shows incredible consistency across all going types when it comes to win rate. Rank 1 leads the field everywhere, staying in a very tight band between 24 percent and 27 percent no matter what the ground conditions are doing. That is a level of stability most ratings simply do not produce.
From there, each rank steps down in predictable fashion. Rank 2 typically sits between 16 percent and 18 percent across most goings, with only small variations. Lower ranks continue that steady decline, which confirms the rating structure is holding firm even as the ground changes.
This level of consistency gives you huge confidence when shortlisting. No matter the going, you know exactly what sort of strike rates you are dealing with across each rank.
Going Analysis Profit
This is where things get more unpredictable. Good going Rank 2 is the clear standout, producing a huge profit of 1536. That is the biggest single profit spike across any going or rank. It backs up what we saw earlier, though caution is still needed given the A/E was neutral.
Soft going also shows strong profits across both Rank 1 and Rank 3, while Heavy going Rank 5 throws up a large profit number driven by just a handful of very big-priced winners. The sample size on that one makes it fragile and high risk.
Overall, profit remains heavily influenced by variance on the lower ranks. The most stable profits are still being found where strike rate and volume combine at the top end of the ratings.
Going Analysis ROI
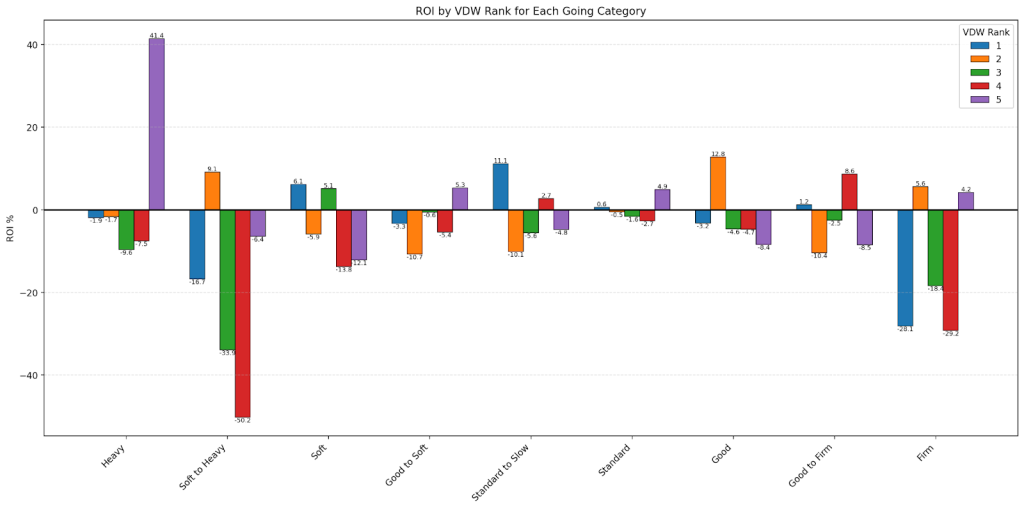
The going analysis of VDW ranks shows just how sensitive profitability is to underfoot conditions—and how unreliable certain ranks can be when conditions shift.
Rank 5, often ignored by most bettors, produced a stunning +41.4% ROI on heavy going—an anomaly that stands out against an otherwise unremarkable field. But in most other goings, especially firmer ground, it reverts to the mean or worse. Ranks 1 and 2, traditionally seen as the most reliable, show notable inconsistency. For example, Rank 1 sinks badly on soft to heavy (-16.7%) and firm ground (-28.1%), but comes alive on standard to slow (+11.1%).
Overall, the takeaway is clear: there’s no single “safe” VDW rank across all goings. Profitability fluctuates dramatically. If you’re using VDW, you must filter by going and avoid assuming consistency from the top ranks alone. In fact, some of the best ROI figures emerge from unexpected places—like Rank 2 on good to firm (+8.6%) and Rank 3 on standard (+2.5%). Ignore these nuances, and you’ll miss where the real value hides.
Going Analysis A/E
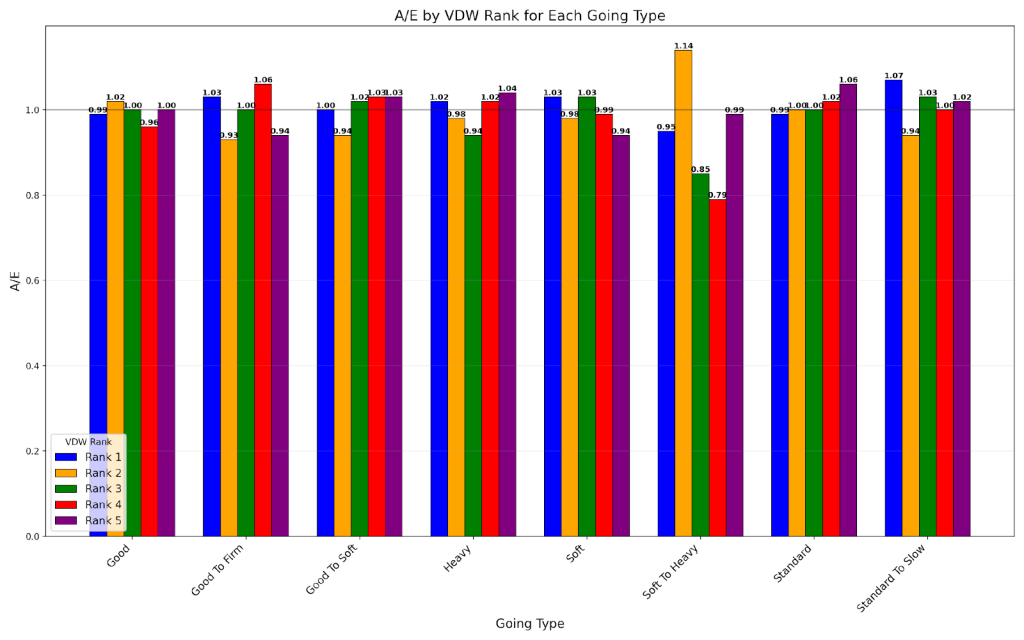
The A/E chart shows just how well balanced the VDW rating is across different going types. Most ranks hover close to 1.00 which confirms that the market is pricing these horses fairly in most conditions.
There are only a few small pockets where potential inefficiency creeps in. Good to firm going Rank 3 hits 1.06, and Heavy going Rank 3 and Rank 5 push slightly above 1.04. These could point to areas worth further testing if you are looking for marginal advantages.
The strongest signal appears at Soft to heavy going Rank 2, where the A/E reaches 1.14. This is one of the clearest signs that the market may be underestimating this group, making it an area that deserves extra attention.
Everywhere else stays remarkably level, which reinforces the VDW rating’s role as a stable foundation that can be fine-tuned with smart filtering.
The VDW Horse Racing Rating by Class
Now we are going to break down how the top five VDW rated horses perform across different race classes. This gives us a much deeper understanding of where the rating holds strongest and where you may need to apply extra filters.
Race class is simply the level of competition. The lower the class number, the higher the quality of horse. Class 1 features the best horses. Class 6 is typically the lower end of racing.
These figures are based on win bets only, but as always, when the win rates or profits drop off, that may create opportunities in other markets such as place or lay betting.
Let’s see how VDW handles the different levels of competition.
Horse Racing on Class 1
| VDW Rank | No. of Horses | Win Rate % | Profit | ROI % | Average Odds | A/E | Sel. Mnth | Est. Drawdown |
| 1 | 2540 | 32.32 | 17.14 | 0.67 | 6.27 | 1.0 | 71 | 20 |
| 2 | 2367 | 17.70 | -347.21 | -14.67 | 10.75 | 0.9 | 66 | 40 |
| 3 | 2299 | 13.53 | 9.34 | 0.41 | 16.40 | 1.0 | 64 | 53 |
| 4 | 2205 | 10.48 | -46.44 | -2.11 | 24.10 | 1.0 | 61 | 70 |
| 5 | 2094 | 6.59 | -425.53 | -20.32 | 39.79 | 0.9 | 58 | 112 |
Class 1 is the highest quality racing, and you can see it reflected immediately in the numbers. Rank 1 is outstanding here, delivering a win rate of 32.32 percent, the highest strike rate across any condition we have seen so far. Even with the market pricing these accurately at an A/E of 1.0, backing these blindly still returns a small profit.
Lower ranks drop away sharply. Rank 2 falls to 17.70 percent win rate with a heavy loss and an A/E of 0.9, which suggests these runners may often be slightly overbet at this level of competition.
Ranks 3 through 5 hold no clear value and show rising drawdowns with declining strike rates. In these top-class races, the safest play remains tightly focused on the highest rated VDW runners.
Horse Racing on Class 2
| VDW Rank | No. of Horses | Win Rate % | Profit | ROI % | Average Odds | A/E | Sel. Mnth | Est. Drawdown |
| 1 | 2337 | 24.05 | 49.03 | 2.10 | 6.76 | 1.0 | 65 | 28 |
| 2 | 2179 | 16.20 | -154.57 | -7.09 | 10.02 | 1.0 | 61 | 43 |
| 3 | 2127 | 12.98 | -28.35 | -1.33 | 15.97 | 1.0 | 59 | 55 |
| 4 | 1991 | 12.05 | 98.50 | 4.95 | 17.37 | 1.1 | 55 | 59 |
| 5 | 1885 | 8.65 | 644.34 | 34.18 | 25.08 | 0.9 | 52 | 83 |
Class 2 produces a more mixed picture for the VDW rating. Rank 1 remains solid, returning a strong 24.05 percent win rate, a profit of 49.03, and an ROI of 2.10 percent. With an A/E of 1.0, these results are right in line with market expectations but still leave a small edge.
The lower ranks are where things get interesting. Rank 4 shows a healthy profit of 98.50 and an A/E of 1.1, which suggests the market may slightly underestimate these runners at this class level. Rank 5 delivers a large profit, but once again this is driven by big-priced winners at low volumes, making it far less reliable.
Ranks 2 and 3 show steady declines with no clear value, while strike rates follow the usual downward pattern. The safest ground remains with Rank 1, but Rank 4 may offer something for those willing to dig deeper.
Horse Racing on Class 3
| VDW Rank | No. of Horses | Win Rate % | Profit | ROI % | Average Odds | A/E | Sel. Mnth | Est. Drawdown |
| 1 | 3698 | 28.12 | -5.07 | -0.14 | 6.02 | 1.0 | 103 | 25 |
| 2 | 3340 | 20.15 | -67.99 | -2.04 | 9.56 | 1.0 | 93 | 36 |
| 3 | 3251 | 15.53 | -173.61 | -5.34 | 15.40 | 1.0 | 90 | 48 |
| 4 | 2946 | 12.22 | -224.55 | -7.62 | 24.93 | 1.0 | 82 | 61 |
| 5 | 2609 | 7.82 | -419.32 | -16.07 | 33.76 | 0.9 | 72 | 97 |
Class 3 sees VDW holding its structure but starting to tighten even further. Rank 1 delivers a very strong win rate of 28.12 percent, one of the highest across all classes, but produces a very small loss with an ROI close to break-even and an A/E of 1.0. The market is pricing these runners very accurately.
Every rank below Rank 1 falls progressively into deeper losses. Rank 2 shows a solid 20.15 percent strike rate but still returns a loss, while Ranks 3 to 5 continue to decline in both strike rate and profit. No clear edge shows up in any of the lower ranks.
For those using VDW in Class 3 races, the message remains clear. Stick with Rank 1. It gives you both high win rates and market stability, even if you are unlikely to find easy profits without adding additional filters.
Horse Racing on Class 4
| VDW Rank | No. of Horses | Win Rate % | Profit | ROI % | Average Odds | A/E | Sel. Mnth | Est. Drawdown |
| 1 | 9842 | 27.23 | -150.34 | -1.53 | 7.90 | 1.0 | 273 | 29 |
| 2 | 8916 | 19.11 | -524.61 | -5.88 | 17.14 | 1.0 | 248 | 43 |
| 3 | 8589 | 14.88 | -57.29 | -0.67 | 30.00 | 1.0 | 239 | 56 |
| 4 | 8106 | 11.20 | -361.38 | -4.46 | 44.39 | 1.0 | 225 | 76 |
| 5 | 7628 | 9.11 | -431.07 | -5.65 | 62.09 | 1.0 | 212 | 94 |
In Class 4 races the pattern remains remarkably stable. Rank 1 continues to deliver strong consistency with a 27.23 percent win rate. Although profit sits slightly negative at minus 150.34, the ROI is only minus 1.53 percent with an A/E of 1.0, showing once again the market is pricing these very tightly.
The usual decline follows through the ranks. Ranks 2 to 5 all sit in loss territory both in profit and ROI. Strike rates drop progressively and the A/E holds steady at 1.0 across most ranks, with no clear sign of inefficiency or untapped value.
Class 4 follows the overall VDW theme perfectly. Stick with Rank 1 for consistency and shortlist building. Any deeper exploration into the lower ranks would require significant additional filtering to uncover opportunities.
Horse Racing on Class 5
| VDW Rank | No. of Horses | Win Rate % | Profit | ROI % | Average Odds | A/E | Sel. Mnth | Est. Drawdown |
| 1 | 10811 | 25.83 | 242.85 | 2.25 | 7.32 | 1.0 | 300 | 31 |
| 2 | 9748 | 17.98 | -568.79 | -5.83 | 13.58 | 1.0 | 271 | 46 |
| 3 | 9434 | 14.24 | -17.48 | -0.19 | 22.23 | 1.0 | 262 | 60 |
| 4 | 9248 | 11.20 | -430.42 | -4.65 | 30.09 | 1.0 | 257 | 77 |
| 5 | 8675 | 9.49 | -204.02 | -2.35 | 40.12 | 1.1 | 241 | 91 |
Class 5 gives us one of the first clear positive profit positions for VDW. Rank 1 continues its remarkable consistency with a win rate of 25.83 percent and delivers a profit of 242.85, producing a positive ROI of 2.25 percent and an A/E of 1.0. Once again, the market is pricing these runners correctly, but the raw profit remains solid.
The rest of the ranks follow the expected pattern. Rank 2 drops into a heavier loss while strike rates decline across ranks 3 to 5. Rank 5 shows a small A/E bump at 1.1, but given the large odds and higher drawdowns, this is not an area to chase without much deeper filtering.
The story stays the same. VDW Rank 1 remains the reliable engine in Class 5, combining stable strike rates, steady volume and a rare positive profit figure without additional filters applied.
Horse Racing on Class 6
| VDW Rank | No. of Horses | Win Rate % | Profit | ROI % | Average Odds | A/E | Sel. Mnth | Est. Drawdown |
| 1 | 6418 | 23.31 | 34.29 | 0.53 | 6.87 | 1.0 | 178 | 33 |
| 2 | 6018 | 17.40 | 241.91 | 4.02 | 12.19 | 1.0 | 167 | 46 |
| 3 | 5946 | 13.30 | -345.51 | -5.81 | 16.47 | 1.0 | 165 | 61 |
| 4 | 5640 | 11.06 | -104.17 | -1.85 | 20.53 | 1.0 | 157 | 74 |
| 5 | 5592 | 9.62 | 334.40 | 5.98 | 24.65 | 1.0 | 155 | 85 |
Class 6 brings an interesting twist. Rank 1 stays consistent with a win rate of 23.31 percent, delivering a small profit of 34.29 and a marginal ROI of 0.53 percent. The A/E stays at 1.0, showing the market remains very efficient even at this lower class level.
What stands out is Rank 2, which posts a significant profit of 241.91 and an ROI of 4.02 percent. Although the A/E remains at 1.0, this suggests that Rank 2 may occasionally fly under the radar in these lower grade races, though variance likely plays a role here.
Lower ranks show the usual deterioration. Rank 3 drops sharply into loss, while Rank 5 throws up a profit of 334.40 and a 5.98 percent ROI. As always with Rank 5, these figures come from smaller volumes and big prices, so caution is advised.
Class 6 still echoes the same pattern. Rank 1 remains your foundation, but Rank 2 is one of the few places in the data where a lower rank shows positive returns that may warrant extra testing.
Horse Racing on Irish Classes
| VDW Rank | No. of Horses | Win Rate % | Profit | ROI % | Average Odds | A/E | Sel. Mnth | Est. Drawdown |
| 1 | 8919 | 23.43 | -171.25 | -1.92 | 9.73 | 1.0 | 248 | 34 |
| 2 | 8258 | 15.00 | 1259.60 | 15.25 | 24.04 | 1.0 | 229 | 55 |
| 3 | 8103 | 11.77 | -348.69 | -4.30 | 39.99 | 1.0 | 225 | 72 |
| 4 | 7957 | 9.22 | -797.19 | -10.02 | 57.78 | 1.0 | 221 | 93 |
| 5 | 7551 | 7.72 | -73.61 | -0.97 | 71.89 | 1.0 | 210 | 111 |
When we look at Irish racing, the VDW rating keeps its structure but throws up a few interesting shifts. Rank 1 maintains a healthy 23.43 percent win rate, staying right in line with expectations, though showing a small loss overall with an ROI of minus 1.92 percent. As always, A/E sits tightly on 1.0.
The standout is Rank 2, which delivers a large profit of 1259.60 and an ROI of 15.25 percent. However, with the A/E still sitting at 1.0, this is most likely driven by variance across a small number of bigger priced winners rather than true market inefficiency.
Ranks 3, 4 and 5 all drop off progressively both in strike rate and profit, which mirrors what we have seen throughout the other class breakdowns.
Once again, Irish racing confirms the stability of Rank 1 as a safe core, while any lower-ranked profit spikes should be treated as highly volatile without additional filtering.
What do these results mean?
Let’s look at the results of our going analysis visually…
Class Analysis Winning Rate
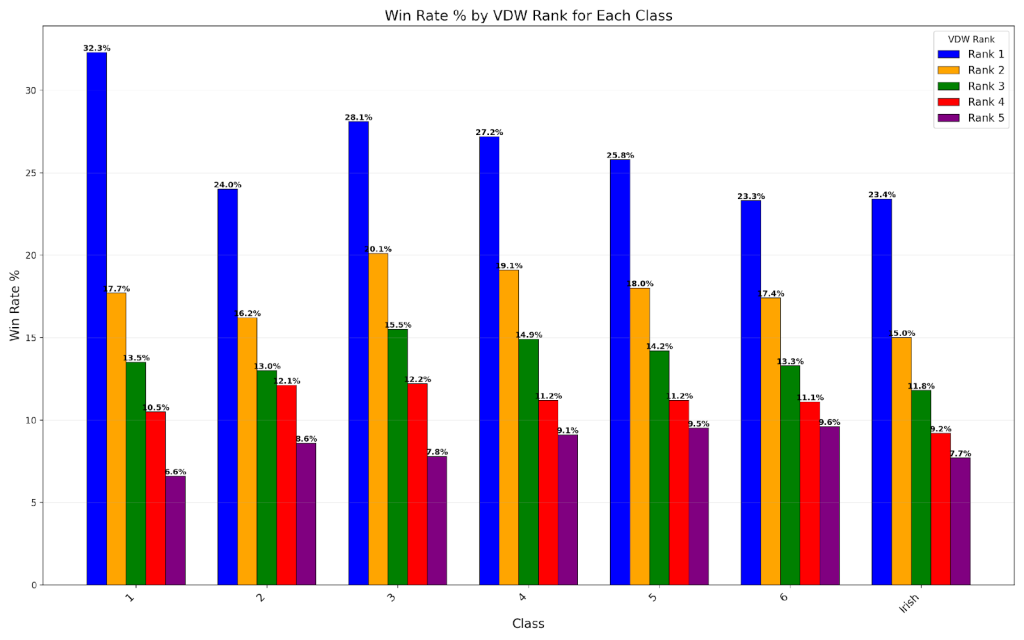
The win rate chart confirms exactly how reliable the VDW rating is across all class levels. Rank 1 dominates every single class, ranging from 23 percent up to over 32 percent in Class 1. The consistency of Rank 1 from top class right down to Class 6 is remarkable and gives a rock-solid foundation for building any shortlist.
As you move down through the ranks, the win rates fall in clean, logical steps. Rank 2 typically sits between 16 and 18 percent across most classes, while Rank 3 holds between 13 and 15 percent, before dropping off more steeply at Ranks 4 and 5.
No matter what class of race you are looking at, the structure of the VDW rating holds its shape. You know exactly what level of strike rate to expect at each rank, which allows you to apply the rating with complete confidence when assessing race strength.
Class Analysis ROI
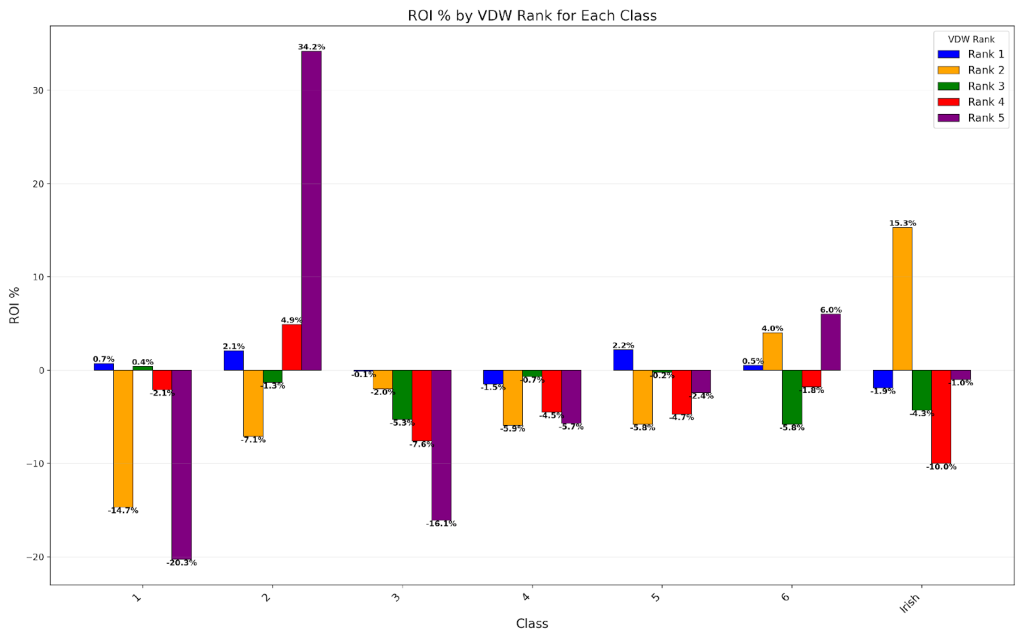
The ROI chart shows exactly where profit opportunities start to thin out and where flashes of value may still exist.
Rank 1 remains steady, delivering small but positive ROI in Class 2, Class 5 and Class 6. Even when it slips slightly negative in some classes, it hovers close to break-even, highlighting just how stable VDW Rank 1 is across all race levels.
The real outliers are in the lower ranks. Class 2 Rank 5 spikes dramatically to 34.2 percent ROI. While eye-catching, this is driven by a small sample of big-priced winners and cannot be treated as stable. Similarly, Class 6 Rank 2 and Rank 5 show small positive ROI, but again, caution is needed without much deeper filtering.
Overall, the profit remains concentrated around Rank 1, while anything deeper into the ranks starts to show sharp swings, driven more by variance than repeatable edge.
Class Analysis Profit
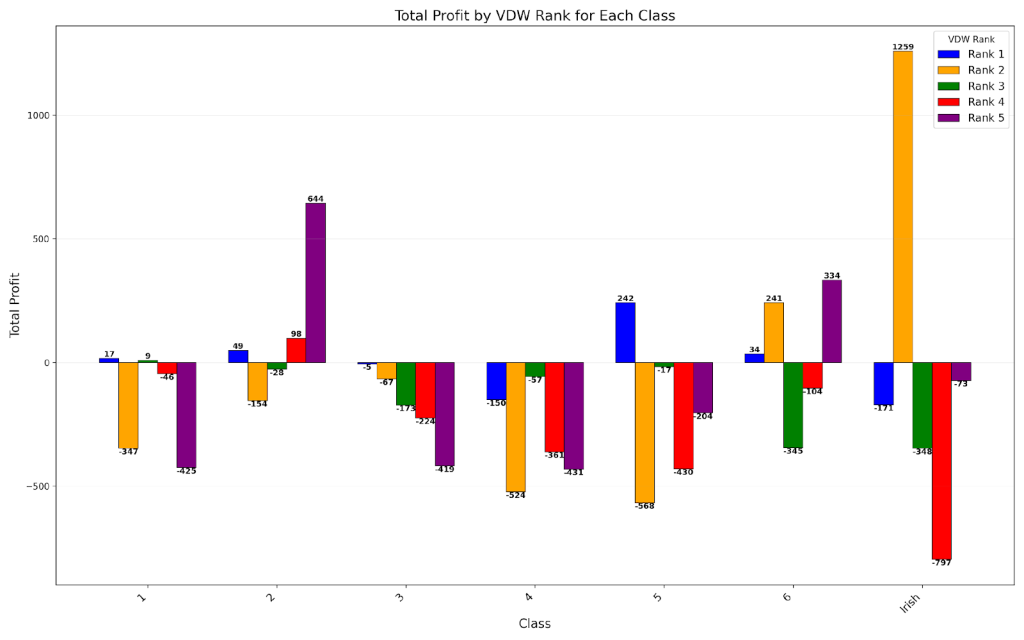
Profit levels by class bring out some clear hotspots and plenty of caution signals.
Class 5 Rank 1 shows one of the strongest profit positions for VDW with a profit of 242. This is one of the few areas where profit aligns with both volume and strike rate, making it one of the more stable profit zones across all classes.
Class 6 Rank 2 and Rank 5 also deliver solid profit at 241 and 334 respectively. As usual, these are worth noting but demand much more care due to their sensitivity to odds swings and lower strike rates.
The real standout anomaly sits in Class 2 Rank 5, which delivers 644 profit, but this is almost entirely driven by very high priced winners, making it highly unstable as a long-term approach.
For most practical betting strategies, Rank 1 remains the steady performer across the board, while any lower-ranked profit spikes should be treated as short-term variance rather than reliable advantage.
Class Analysis A/E
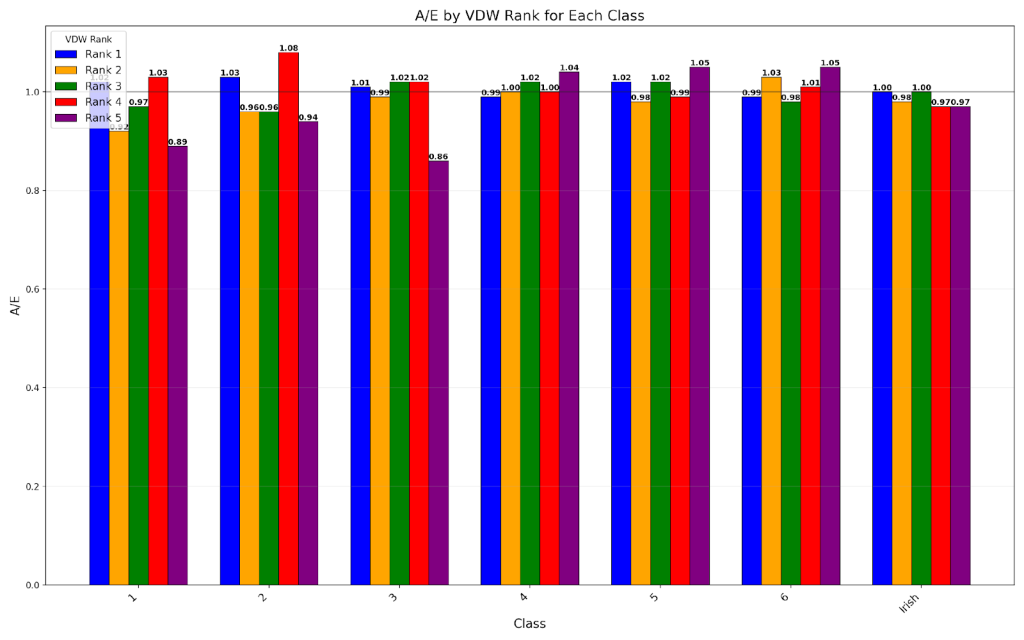
The A/E chart confirms once again how incredibly well-balanced the VDW rating is across all class levels. For the majority of classes and ranks, A/E stays very close to 1.0 which tells us the market is doing a very accurate job of pricing these horses based on their VDW rankings.
There are a few small signals where inefficiencies may exist. Class 2 Rank 4 pushes up to 1.08, suggesting a slight undervaluing by the market in this small segment. Class 4 and Class 5 Rank 5 also nudge slightly above 1.04 to 1.05, but these minor movements would need further deeper investigation before relying on them for betting purposes.
The key takeaway here is the strength of the VDW structure. It consistently delivers reliable strike rates across classes while staying tightly priced against market expectation. This leaves little room for major blind profits but offers a very strong base for building more sophisticated strategies.
In summary
The VDW rating continues to prove itself as one of the most consistent and stable rating systems across every class level, including both UK and Irish racing. Rank 1 holds steady with excellent strike rates across the board, while the market prices these horses with great accuracy, reflected by A/E figures sitting tightly around 1.0.
Profits remain concentrated in small pockets. Class 5 Rank 1 delivers one of the most stable and reliable profit zones, while Class 2 Rank 5, Class 6 Rank 2 and 5, and now Irish Class Rank 2 show occasional profit spikes. However, these are typically driven by variance from big-priced winners and should not be relied on without much deeper analysis.
The real strength of the VDW rating by class remains crystal clear:
Use Rank 1 as your foundation across all class levels. You are working from a place of high strike rates, accurate pricing, and predictable results that allow you to build long-term strategies with confidence.
The VDW Horse Racing Rating by Runners
Horse Racing on a Small Field (2-8)
| VDW Rank | No. of Horses | Win Rate % | Profit | ROI % | Average Odds | A/E | Sel. Mnth | Est. Drawdown |
| 1 | 5250 | 27.05 | -51.24 | -0.98 | 7.57 | 1.0 | 5250 | 27 |
| 2 | 4887 | 17.97 | 177.70 | 3.64 | 15.42 | 1.0 | 4887 | 43 |
| 3 | 4653 | 14.44 | -192.76 | -4.14 | 27.79 | 1.0 | 4653 | 54 |
| 4 | 4453 | 10.46 | -416.92 | -9.36 | 37.83 | 1.0 | 4453 | 76 |
| 5 | 4141 | 7.92 | -736.03 | -17.77 | 56.69 | 0.9 | 4141 | 101 |
The VDW rating thrives in small field sizes, offering some of its most consistent strike rates and a few glimmers of profit potential.
Rank 1 delivers a strong win rate of 27.05 percent — one of the best across all breakdowns — and stays close to break-even with an ROI of minus 0.98 percent. It holds steady with an A/E of 1.0, showing the market is still razor-sharp in pricing these top-ranked runners.
Rank 2 jumps out with a profit of 177.70 and an ROI of 3.64 percent. While the A/E is still 1.0 — suggesting no statistical edge — this profit level, paired with a solid 17.97 percent win rate, means it’s a prime candidate for further filtering and FMFR refinement.
As expected, Ranks 3 to 5 fall away. Strike rates decline, losses mount, and by the time you get to Rank 5, you’re staring at a negative ROI of minus 17.77 percent with a hefty drawdown to match. The A/E of 0.9 is the only one below 1.0, reinforcing that the market may actually be overestimating these lower ranks in smaller fields.
In short: VDW Rank 1 is reliable, Rank 2 is intriguing, and the rest need to be approached with caution or reframed through a laying or place betting lens.
Horse Racing on a Medium Field (9-11)
| VDW Rank | No. of Horses | Win Rate % | Profit | ROI % | Average Odds | A/E | Sel. Mnth | Est. Drawdown |
| 1 | 3543 | 26.90 | 41.38 | 1.17 | 7.62 | 1.0 | 3543 | 26 |
| 2 | 3232 | 17.36 | 4.51 | 0.14 | 16.92 | 1.0 | 3232 | 42 |
| 3 | 3241 | 13.17 | 62.89 | 1.94 | 26.80 | 1.0 | 3241 | 57 |
| 4 | 3027 | 11.10 | -218.80 | -7.23 | 37.50 | 1.0 | 3027 | 68 |
| 5 | 2693 | 8.06 | -340.30 | -12.64 | 51.15 | 0.9 | 2693 | 94 |
In medium-sized fields, the VDW rating continues to deliver, but with some surprising shifts across the ranks.
Rank 1 posts a very strong 26.90 percent win rate and actually edges into profit, returning 41.38 units with a 1.17 percent ROI. This is one of the rare cases where Rank 1 combines strike rate, volume and a touch of profit, while holding an A/E of 1.0 — proving the market is spot on, but there’s still a little juice to be squeezed.
Rank 3 is the anomaly here. Despite only a 13.17 percent win rate, it produced a profit of 62.89 and an ROI of 1.94 percent. With A/E still at 1.0, this is almost certainly down to a few bigger priced winners skewing the figures rather than a structural advantage.
Ranks 4 and 5 drop off the cliff again, both showing heavy losses and A/E figures that either stick to 1.0 or, in the case of Rank 5, slide to 0.9 — a clear sign that the market overvalues these horses.
Overall, medium fields are where VDW shows a steady, reliable shape — with Rank 1 being the obvious stronghold and Rank 3 worth further review if you’re targeting big prices with tight filters.
Horse Racing on a Large Field (12-14)
| VDW Rank | No. of Horses | Win Rate % | Profit | ROI % | Average Odds | A/E | Sel. Mnth | Est. Drawdown |
| 1 | 737 | 27.68 | -80.19 | -10.88 | 6.36 | 0.9 | 737 | 20 |
| 2 | 678 | 19.91 | 12.61 | 1.86 | 15.35 | 1.0 | 678 | 29 |
| 3 | 641 | 14.66 | 6.09 | 0.95 | 33.44 | 1.0 | 641 | 41 |
| 4 | 587 | 11.58 | -35.75 | -6.09 | 51.63 | 1.1 | 587 | 52 |
| 5 | 643 | 9.80 | 814.97 | 126.74 | 61.37 | 1.2 | 643 | 63 |
Now things get a little wilder. In larger fields, VDW’s reliable shape starts to fray around the edges, with unexpected performances bubbling up from the lower ranks.
Rank 1 actually holds its best win rate yet — 27.68 percent — but the profit line flips. It loses 80.19 units, with an ROI of minus 10.88 percent and an A/E of 0.9. That drop below 1.0 is important — it tells us the market may be overvaluing Rank 1 horses in these busy, more unpredictable races.
Rank 5, on the other hand, delivers a huge surprise. Despite only a 9.80 percent win rate, it returns a monster profit of 814.97 units and an ROI of 126.74 percent. The A/E backs it up at 1.2 — suggesting that, in these larger fields, the worst-rated horses might actually be getting ignored by the market, occasionally striking at massive odds.
Ranks 2, 3 and 4 hover in the middle. Rank 2 edges a tiny profit, Rank 3 shows a small gain as well, while Rank 4 is a slight loss — but the overall takeaway is that variance increases dramatically as field size grows.
Large fields mean more chaos, more longshots, and much more fluctuation in the data. This is where patient, selective strategies targeting big odds and lightly rated horses may bear fruit — but not without risk.
Horse Racing on a Very Large Field (15+)
| VDW Rank | No. of Horses | Win Rate % | Profit | ROI % | Average Odds | A/E | Sel. Mnth | Est. Drawdown |
| 1 | 35035 | 25.42 | 106.70 | 0.30 | 7.72 | 1.0 | 35035 | 36 |
| 2 | 32029 | 17.53 | -356.48 | -1.11 | 15.49 | 1.0 | 32029 | 54 |
| 3 | 31214 | 13.66 | -837.81 | -2.68 | 24.78 | 1.0 | 31214 | 70 |
| 4 | 30026 | 10.87 | -1194.18 | -3.98 | 35.39 | 1.0 | 30026 | 90 |
| 5 | 28557 | 8.88 | -313.45 | -1.10 | 45.84 | 1.0 | 28557 | 110 |
Once you get into the chaos of 15 runners or more, the VDW rating holds its structural shape — but it does so under pressure.
Rank 1 remains strong in win rate at 25.42 percent, and interestingly it edges back into profit with a return of 106.70 and a small ROI of 0.30 percent. The A/E stays locked at 1.0, which tells us the market is pricing these horses with total efficiency — and yet, with this much volume, a slim edge can still translate into long-term results.
From Rank 2 downwards, the picture darkens. Every rank shows a loss. ROI drops below minus 1.00 percent by Rank 2, hits minus 2.68 percent at Rank 3, and plummets to minus 3.98 and minus 1.10 at Ranks 4 and 5 respectively. A/E holds flat at 1.0 across the board, giving us no indication of exploitable edge — just proof that in massive fields, outcomes become more randomised and price pressure sets in.
What’s key here is that the drop-off from Rank 1 to everything else is steep in terms of profitability, even though strike rates follow a smooth curve. The betting market simply doesn’t allow enough slack to find easy value outside the top.
So if you’re playing the big fields, stick to Rank 1 and sharpen your filters — because beyond that, the risk outpaces the reward fast.
What do these results mean?
Let’s look at the results of our going analysis visually…
Number of Runners Analysis Winning Rate
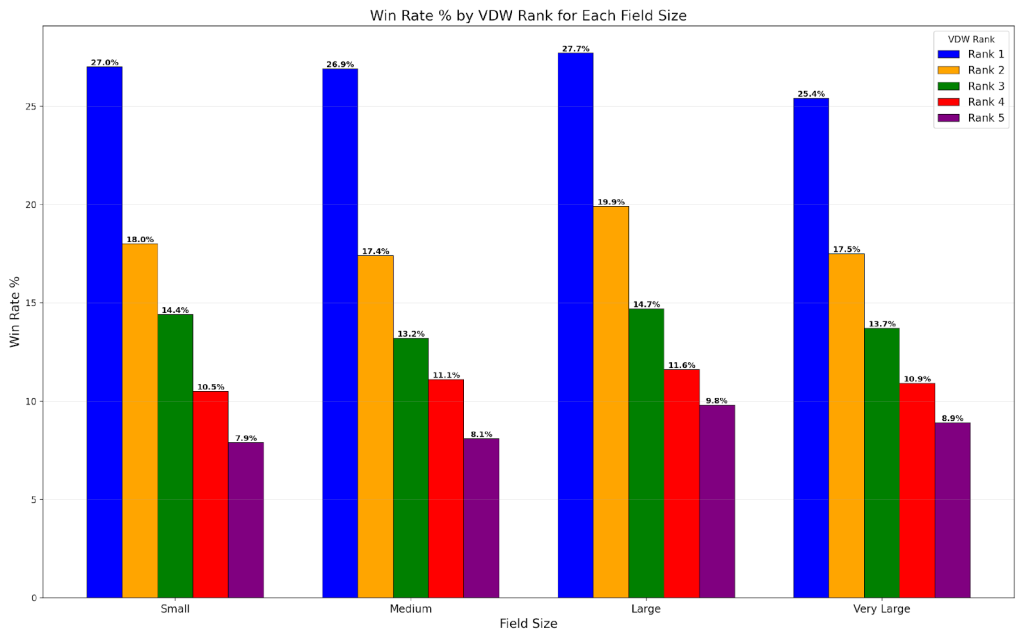
When it comes to field sizes, Rank 1 doesn’t flinch. It holds firm at the top of the table across the board — 27.7% win rate in large fields, 27.0% in small fields, 26.9% in medium fields, and still a strong 25.4% even in the chaotic very large fields. That kind of consistency in changing race dynamics is rare — and valuable.
Rank 2 isn’t far behind in large fields either, hitting a solid 19.9% — its best return — while hovering respectably between 17.4% and 18.0% elsewhere. It’s the clear second-in-command and might even be worth a second glance when the field count hits double digits.
Ranks 3 through 5 continue the expected drop-off. Rank 3 sticks between 13.2% and 14.7%, Rank 4 stays in the 10.5%–11.6% range, and Rank 5 stays in single digits — dipping as low as 7.9% in small fields.
The verdict? Rank 1 is a powerhouse no matter how many line up at the start. But Rank 2’s strength in larger fields might be a sweet spot for value-focused analysis.
Number of Runners Analysis ROI Rate
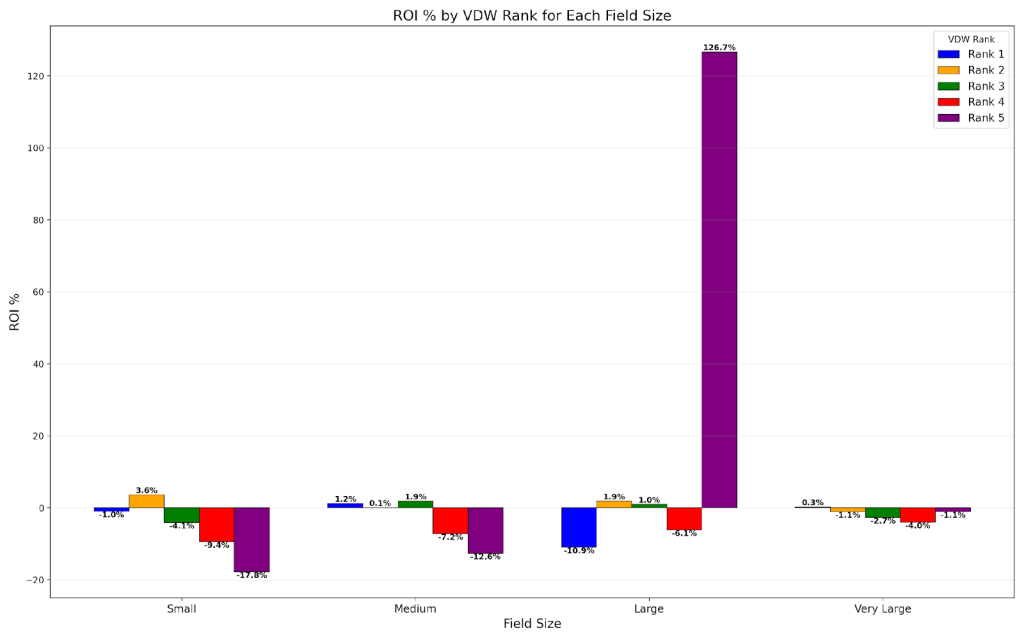
When it comes to return on investment, the field size throws a proper curveball — especially if you’re brave enough to explore the chaos of larger line-ups.
Rank 5, usually the laggard, completely flips the script in large fields (12–14) with a ridiculous +126.7% ROI. That’s not a typo. It’s a reminder that the bottom-ranked runners can produce bombs when the conditions — and odds — align. But before you go all-in, notice that it also posts the worst ROI in small fields at -17.8%. Volatility is the name of the game.
Rank 1, our win-rate king, shows a mixed bag. It’s only slightly negative or mildly positive:
- +1.2% in medium fields
- -1.0% in small fields
- -10.9% in large fields
- -0.3% in very large fields Clearly consistent for winners, but not bank-breaking in terms of profit.
Rank 2 stays surprisingly balanced, hovering close to breakeven or slightly above — +3.6% in small fields, +1.9% in both medium and large fields, and +0.3% even in very large fields. Quietly, this might be your best long-term value play — especially where chaos increases payout potential.
Ranks 3 and 4 struggle to make a case profit-wise. They’re red across most sizes and don’t offer much upside unless you’re chasing edge-case scenarios.
The ROI takeaway?
Rank 5 in large fields is the standout for profit hunters, but tread carefully — the drawdowns are brutal elsewhere. Rank 2, though, shows solid value potential across all field sizes with less risk and a steadier line. Rank 1? Great for win rate… but don’t count on it to pad your wallet unless you’re staking smartly.
Number of Runners Analysis Profit Rate
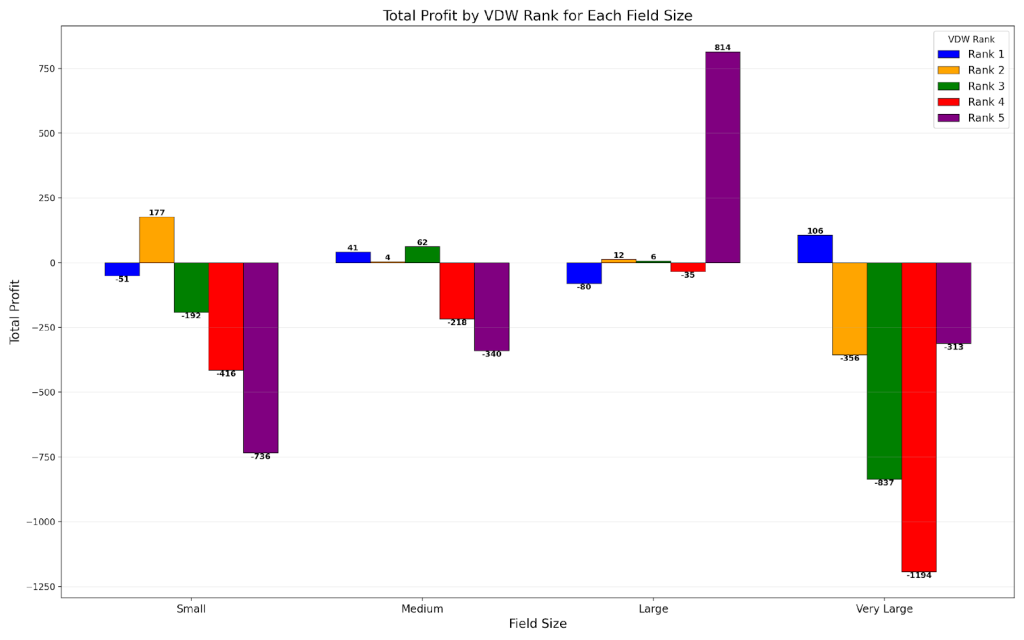
Once we break races down by field size, the VDW hierarchy doesn’t collapse — but it certainly starts to flex.
Rank 1 leads every category comfortably, with win rates hovering between 25.4% and 27.7% regardless of how many runners are involved. But performance sharpens in large and medium fields, where ROI edges into the black and total profit climbs to +£106 and +£41, respectively.
Rank 2 puts up its best showing in small fields, returning a profit of +£177 and posting a 3.6% ROI — the best return at this rank across all sizes. But it fades fast as the field grows, dipping into heavy losses by the time it hits 15+ runners.
Rank 3 is the classic false promise: win rates remain respectable, but very large fields crush it (–£837), and the only mild redemption comes in medium setups where it scrapes a +£62 gain.
Ranks 4 and 5 tell a chaotic story. Rank 4 is underwater everywhere. Rank 5 is the anomaly — bleeding money across small, medium, and very large races, but somehow smashing a +£814 profit in large fields with a 126.7% ROI. That spike is real, but rare.
So what’s the takeaway?
Rank 1 is rock solid across all field sizes. Rank 2 thrives in small fields. Rank 5 is a wild card worth watching in large setups — but only if you’re ready to stomach the variance.
Number of Runners Analysis A/E Rate
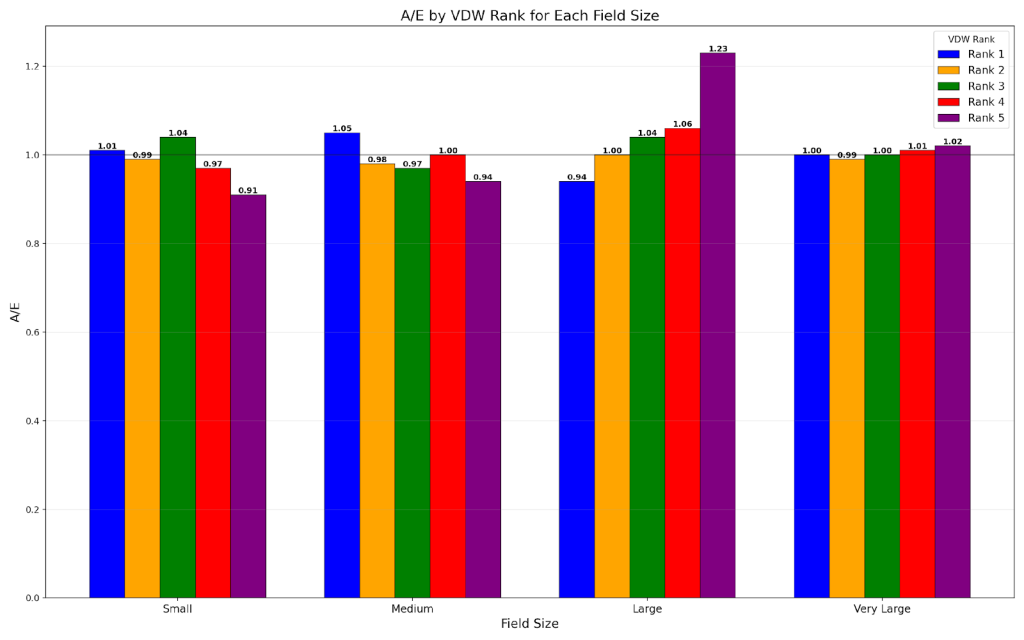
Across field sizes, the A/E (Actual vs. Expected) tells a more nuanced story — not of dominance, but of subtle edges… and one serious outlier.
Small and Medium Fields keep things tight. Most A/E values hover between 0.91 and 1.05, showing that the market is pricing things pretty efficiently. Rank 1 edges out a tiny advantage in medium fields at 1.05, but there’s no clear exploitable edge.
Very Large Fields (15+) flatten things even more. Every VDW rank hovers between 0.99 and 1.02, meaning expected and actual outcomes align almost perfectly. This is where the market really earns its reputation.
But in Large Fields (12–14), something breaks the mould:
Rank 5 spikes to 1.23, the highest A/E across any field size — and that lines up with the same field where it posts that freakish +£814 profit and 126.7% ROI. In short: the market misprices these outsiders in large fields, and they occasionally land big.
Everything else is noise. But that Rank 5 large-field anomaly? That’s the one worth circling.
In summary
Field size doesn’t break the VDW model — but it does bend it.
Rank 1 is the backbone. It holds the top win rate in every category, from 27.7% in large fields to 25.4% in very large, with medium and small fields offering the best blend of strike rate and profit. In fact, medium fields (9–11) are Rank 1’s sweet spot — posting a 1.17% ROI and +£41 in profit, with a dependable A/E of 1.0. Solid, steady, consistent.
Rank 2 is quietly valuable. It shows modest ROI across all field sizes — peaking at +3.6% in small fields with a +£177 profit — and never falling off a cliff. In very large fields it even manages to scrape a 0.3% ROI. If you’re looking for a long-term, lower-volatility play outside Rank 1, this is your candidate.
Rank 3 teases potential but rarely delivers. It’s mildly profitable in medium fields (+£62) and slightly up in large fields (+£6), but crashes hard in very large races (–£837) where volatility eats it alive. The A/E stays around 1.0, meaning the market knows what it’s doing.
Rank 4 is a no-go across the board. Losses build. ROI is red. A/E might flicker above 1.0 in places, but it’s not backed by performance. If there’s a case for this rank, it’s for laying, not backing.
Rank 5 is the wildcard — and in large fields (12–14), it explodes. Despite a win rate of just 9.80%, it posted an eye-popping +£814 profit and 126.7% ROI, with an A/E of 1.23 — the highest in the dataset. Everywhere else? Disaster. The volatility is real, and the edge seems unique to this specific scenario.
The market is generally efficient: A/E values cluster around 1.0, especially in very large fields where the market nails its pricing. But where anomalies emerge — like Rank 5 in large fields — they’re rare, but very real.
TL;DR:
Ranks 3 and 4? Tread carefully — the signals are weak, and the risks stack up.
Rank 1 is your foundation, especially in medium and large fields.
Rank 2 offers value in small fields and holds up well elsewhere.
Rank 5 is boom-or-bust, but worth targeting in large fields if you can handle the swings.
The VDW Horse Racing Rating by Distance
Horse Racing in a Sprint (5f-7f)
| VDW Rank | No. of Horses | Win Rate % | Profit | ROI % | Average Odds | A/E | Sel. Mnth | Est. Drawdown |
| 1 | 10999 | 24.58 | 227.81 | 2.07 | 7.14 | 1.0 | 10999 | 33 |
| 2 | 10122 | 16.90 | -543.28 | -5.37 | 12.69 | 1.0 | 10122 | 50 |
| 3 | 9708 | 13.77 | 74.30 | 0.77 | 19.20 | 1.0 | 9708 | 62 |
| 4 | 9501 | 10.90 | 429.61 | 4.52 | 25.52 | 1.0 | 9501 | 79 |
| 5 | 9110 | 9.14 | -357.13 | -3.92 | 34.36 | 1.0 | 9110 | 95 |
Sprints are usually chaos — but the VDW ranks keep a bit of order here.
Rank 1 gets it done. 24.58% win rate, just over £227 profit, and a rare positive ROI. That’s as close as we get to a sprint-safe zone. Reliable, steady, no complaints.
But Rank 2? Total letdown. It usually plays second fiddle well, but here it burns over £500 and delivers nothing back. Whatever edge it had, the market’s priced it out in the short stuff.
Then things get weird. Rank 3 and Rank 4 both sneak into profit. Rank 4 especially jumps out with £429 profit and over 4.5% ROI — not what you’d expect. That’s not form, it’s just sprints doing sprint things. Big odds, big swings.
And Rank 5… well, it does what it always does. Win rate in the bin, losses stacking, volatility through the roof.
So yeah — if you’re betting short, Rank 1’s your anchor. Ranks 3 and 4? They’ve got spark, but don’t trust them blindly. And Rank 2? Leave it out, it’s not sprinting for your wallet.
Horse Racing in a Mile (7f-1m2f)
| VDW Rank | No. of Horses | Win Rate % | Profit | ROI % | Average Odds | A/E | Sel. Mnth | Est. Drawdown |
| 1 | 10134 | 24.22 | -148.26 | -1.46 | 7.73 | 1.0 | 10134 | 33 |
| 2 | 9111 | 17.53 | -166.36 | -1.83 | 14.25 | 1.0 | 9111 | 47 |
| 3 | 8944 | 13.45 | 160.00 | 1.79 | 23.51 | 1.0 | 8944 | 63 |
| 4 | 8697 | 11.18 | -116.44 | -1.34 | 31.85 | 1.0 | 8697 | 77 |
| 5 | 8351 | 9.17 | 365.35 | 4.37 | 40.86 | 1.0 | 8351 | 94 |
These mile races are a strange breed. The VDW ranks keep their shape, but the market’s clearly got them figured out.
Rank 1 lands over 24% winners, which is bang on for reliability — but it still churns out a loss. Not huge, but enough to keep your wallet twitchy.
Rank 2 is more of the same. Good strike rate, but more cash down the drain. Both are priced so tight it’s like the bookies are reading your notes.
Then Rank 3 shows up quietly with a £160 profit. Nothing flashy, but at nearly 24/1 average odds, it’s likely carried by a couple of big pops — exactly the kind of thing worth a second look with sharper filters.
And if you’re feeling brave, Rank 5 throws in a surprise. A lower win rate, sure, but somehow pulls £365 profit and a 4.37% ROI. It’s messy, it’s rare, and it’s not for the faint-hearted — but it might just reward the bold.
So, steady at the top, sneaky value in the middle, and the occasional bomb from the bottom. Classic mile mayhem.
Horse Racing in a Middle (1m2f-2m1f)
| VDW Rank | No. of Horses | Win Rate % | Profit | ROI % | Average Odds | A/E | Sel. Mnth | Est. Drawdown |
| 1 | 11967 | 27.58 | 111.22 | 0.93 | 7.89 | 1.0 | 11967 | 29 |
| 2 | 11131 | 17.95 | 787.89 | 7.08 | 18.01 | 1.0 | 11131 | 47 |
| 3 | 10825 | 13.99 | -103.21 | -0.95 | 31.20 | 1.0 | 10825 | 62 |
| 4 | 10285 | 10.83 | -1021.22 | -9.93 | 45.57 | 1.0 | 10285 | 81 |
| 5 | 9666 | 8.08 | -588.17 | -6.08 | 61.59 | 1.0 | 9666 | 109 |
This is where the VDW ratings really stretch their legs.
Rank 1 nails it — again. Highest strike rate at 27.58%, over £111 profit, and the lowest drawdown of the bunch. The ROI’s modest (0.93%), but that’s what you expect from the market leader: steady, sharp, efficient.
But then Rank 2 shows up and blows the doors off. £787 profit and a 7.08% ROI? That’s not just solid — that’s standout stuff. It’s rare to see this kind of value in a second-ranked horse. Especially at average odds of 18s.
Rank 3 starts the slide. Win rate drops under 14%, and it loses £100. Not terrible, but not helping your bankroll either.
Rank 4? A proper money pit — over a grand down and a near double-digit negative ROI. Rank 5’s not much better. Low strike rate, big losses, huge drawdowns. Classic outsiders. Dangerous without the right filters.
So what’s the move here? Stick with Rank 1 for stability, but Rank 2 might just be the golden ticket in these middle-distance races. Big volume, decent odds, and the stats to back it up.
Horse Racing in a Long (2m1f+)
| VDW Rank | No. of Horses | Win Rate % | Profit | ROI % | Average Odds | A/E | Sel. Mnth | Est. Drawdown |
| 1 | 11465 | 26.37 | -174.12 | -1.52 | 7.88 | 1.0 | 11465 | 31 |
| 2 | 10462 | 17.99 | -239.91 | -2.29 | 16.98 | 1.0 | 10462 | 47 |
| 3 | 10272 | 13.67 | -1092.68 | -10.64 | 26.93 | 1.0 | 10272 | 63 |
| 4 | 9610 | 10.52 | -1157.60 | -12.05 | 40.24 | 1.0 | 9610 | 83 |
| 5 | 8907 | 8.58 | 5.14 | 0.06 | 52.93 | 1.0 | 8907 | 101 |
Endurance tests bring predictability at the top — and chaos everywhere else.
Rank 1 holds its shape well with a 26.37% win rate. It’s consistent, steady, but slightly underwater at -£174 and a -1.52% ROI. Still, if you’re after strike rate, this is where you anchor your bets.
Rank 2 does what Rank 2 does — decent win rate (17.99%) but the profit’s not there. A -2.29% ROI tells us the market’s just a step ahead.
Then we fall off a cliff.
Rank 3 is brutal: over a grand lost and a -10.64% ROI. Rank 4 is even worse — near-identical strike rate to Rank 3 but loses more than £1,150. Not to be touched unless you’re laying or filtering hard.
Rank 5? Technically in profit (+£5), but that’s smoke and mirrors. The ROI’s basically breakeven, and you’re betting at average odds over 50/1. That’s variance, not edge.
If you’re dabbling in marathon territory, you’re betting into tighter markets and bigger swings. Rank 1 gives you control. Everything else? Tread carefully.
What do these results mean?
Let’s look at the results of our going analysis visually…
Distance Analysis Winning Rate
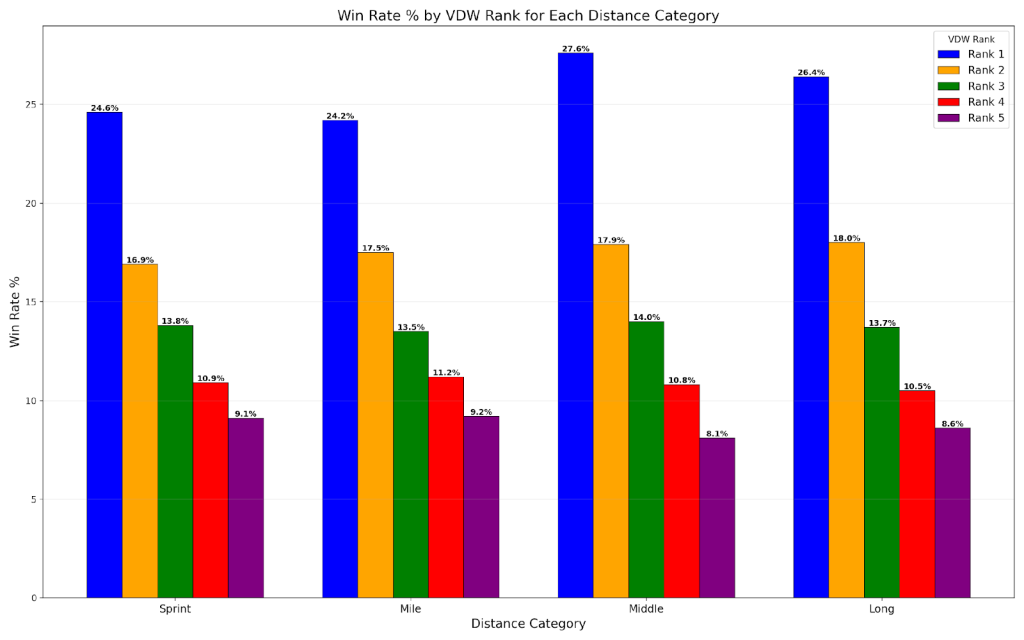
Rank 1 stays top dog, no matter the trip. It ranges from 24.2% to 27.6%, with middle-distance races showing the sharpest strike.
Rank 2 settles comfortably in the high teens, consistent across all distances.
After that, the drop-off is real. Rank 3 flatlines between 13.5% and 14%. Ranks 4 and 5 keep falling, with Rank 5 barely clinging to 9% in sprints and even less beyond.
The hierarchy holds. The longer the race, the more the ranks spread — but Rank 1 never flinches.
Distance Analysis ROI Rate
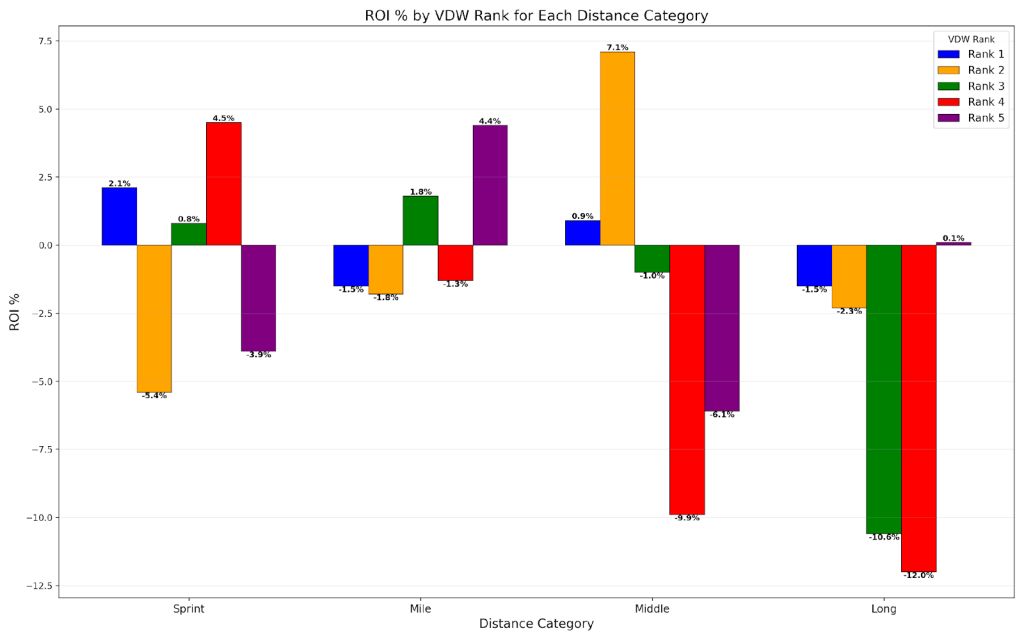
Now we’re into murkier waters. ROI doesn’t care about rank loyalty — it bounces around like a green 33/1 shot at Brighton.
- Middle-distance Rank 2 steals the show with a 7.1% ROI. That’s real punch.
- Sprint Rank 4 pops up with 4.5%, but don’t let one surprise turn into a strategy.
- Rank 1 is steady-ish: mild positives in sprint and middle, but it turns red over longer trips.
- Long-distance? A graveyard. Four of the five ranks post negative ROI, with Rank 4 crashing to –12.0%.
In short: middle-distance Rank 2 is the ROI sweet spot. Beyond that, tread carefully — it’s more swing than science.
Distance Analysis Profit Rate
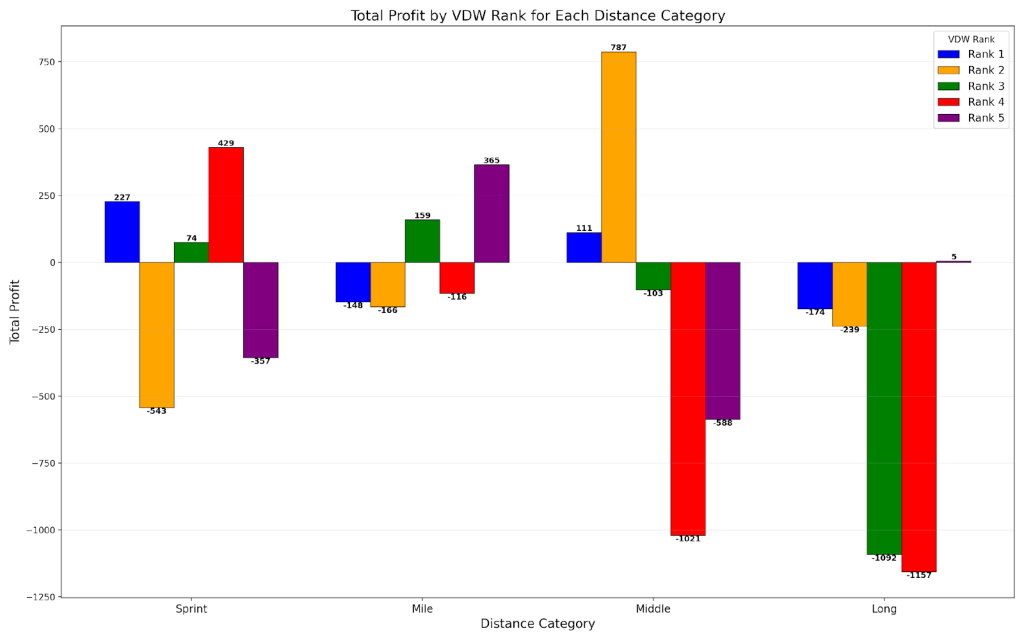
The profit chart’s a wild ride — with some punchy winners and a few faceplants.
- Middle-distance Rank 2 is the star: +£787. That’s standout territory for a second-ranked runner.
- Sprint Rank 4 fires in a surprise +£429, which sounds great… but don’t forget the volatility that comes with it.
- Rank 1 sneaks into the black for sprints and middle races — nothing explosive, but quietly solid.
- Long-distance? Forget it. Four of the five ranks are deep in the red, with Rank 4 losing over a grand.
So if you’re chasing profits by distance, middle-distance Rank 2 is gold dust. Just steer clear of the long hauls unless you enjoy pain.
Distance Analysis A/E Rate
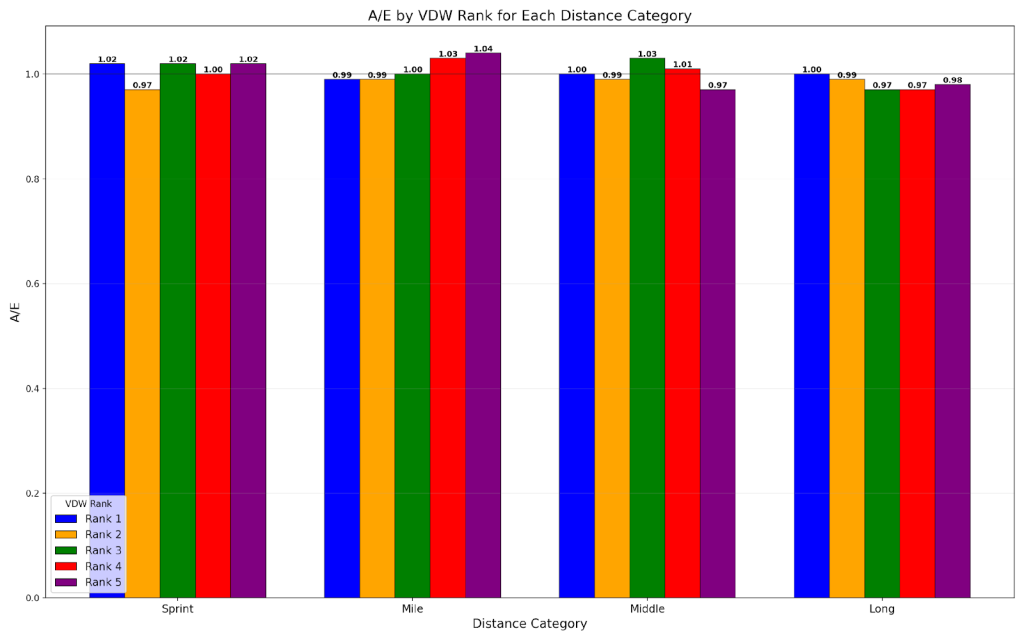
A/E stays mostly tight across the board — which tells us one thing: the market’s got this covered.
But there’s a blip.
- Mile races show a little leakage — Rank 5 at 1.04, Rank 4 at 1.03 — not huge, but enough to flag that outsiders may be slipping past the market’s radar.
- Sprint and Middle give Rank 1 a tiny A/E edge at 1.02 and 1.00, while the rest balance around the 1.0 mark.
- Long-distance races? Almost everything is pegged right around 1.0 — total market efficiency, and no room to move.
Nothing here screams value, but those small gains over a mile are worth a nudge if you’ve got filtering in your toolkit.
In summary
Let’s cut to it: distance changes everything.
You’d think the VDW ranks would behave the same across the board… but nope. Some thrive, others fall apart, and a few chuck in some real surprises.
Sprint races (5f–7f)
Rank 1 holds its ground — solid strike rate, little chunk of profit. Job done.
But then Rank 4 turns up like a drunk party guest and throws down £429 profit out of nowhere. That’s not reliability — that’s chaos that happened to land.
Rank 2? It just collapses. One of the worst performances anywhere. Clearly overpriced, clearly not worth chasing here.
Mile races (7f–1m2f)
Bit of a weird one.
Rank 1 sticks to its usual — steady wins, modest loss.
But then Rank 3 and Rank 5 sneak into profit. Not huge wins, but enough to make you raise an eyebrow if you like playing around with bigger prices.
Definitely feels like this is the playground for big-priced filters and value angles, rather than straight backing.
Middle-distance (1m2f–2m1f)
Here’s where it gets spicy.
Rank 2 lights up the board with nearly £800 profit and a 7% ROI. That’s not a fluke. That’s a sweet spot.
Rank 1 does well too, nice and steady.
The rest? They crash. Especially Rank 4 — a car crash of red numbers.
Long-distance (2m1f+)
It all goes flat.
Strike rates stay decent, but the profits just vanish.
Even Rank 1 can’t dig itself out of the hole here. And while Rank 5 somehow breaks even, let’s not kid ourselves — this is murky territory. High volatility, low trust.
So what’s the move with distance?
- Stick with Rank 1 if you want consistency — just don’t expect fireworks.
- Rank 2’s your go-to over middle trips, but bin it for sprints.
- Sprint Rank 4 might tempt you, but that’s variance talking.
- Anything beyond a mile? You’re in deep water — and filters become non-negotiable.
You’re not just betting on horses — you’re betting on how distance messes with logic. Play it sharp, stay flexible, and use the chaos where it counts.
The Bottom Line
The numbers don’t lie—but they don’t tell the whole story either.
What this deep dive shows is simple: VDW can still hold its own, but only if you know how to apply it. Class is king. Consistency matters. And the betting market—despite all its flaws—still gives you a powerful edge when you use it as a filter, not a crutch.
Trying to force profits from big prices and longshots? You’re playing the wrong game. The data here makes one thing clear: you win by narrowing the field, not by betting against the market for the sake of it.
Use VDW as it was meant to be used: a method for reducing chaos, not chasing miracles. Focus on races with clean data. Work within the top five in the betting. Combine form, ability, and consistency to get a shortlist worth your attention.
That’s how you go from guessing… to knowing.
Read more horse racing rating stats articles…


Get access to the PR and VDW ratings and find top-rated winners every day.

Find out which horse has been tipped by the most newspaper tipsters each day.
Stop doing all the hard work yourself and get access to daily tips.

Find out which horse is predicted to be the fastest horse.
Track horses, trainers and jockeys, get instant alerts when they're running and see how profitable you are using them.
Stop working out the results of your bets by hand. Simply add your bets each day and let us automatically show you the results.
Saturday Horse Racing Tipster Proofing
Stratford - 12:25
Hi
I found this fascinating. Thanks for sharing it with me.
I’ve been looking at combining PR and VDW ratings.
What you’ve provided here is making me look at things very differently. It also raises many questions. What if we go EW when the price allows?
What if we bring in other factors like trainer and jockey form?
There’s gold here and certainly a lot of entertainment!
Thank you so much.
Thank you Peter, that’s great to hear that you’ve found it so useful 🙂
Can you do a similar post based on PR ratings as it would be fascinating to compare the 2, I have managed to do a couple of months worth (which took a while) and PR ratings seemed to fo better for example backing all PR rat7ed 1 horses in June would have made a 54 point profit but the VDW only 21 points profit with some nig draw downs of 30+ so might only use PR Ratings
Absolutely, you can find it at https://raceadvisor.co.uk/the-pr-horse-racing-rating-stats/
Great in depth research Michael, bravo!
Thank you David.